Blog

Notes on custom data integration: connecting systems, keeping mappings explicit, and keeping the pipeline working after the first successful run.

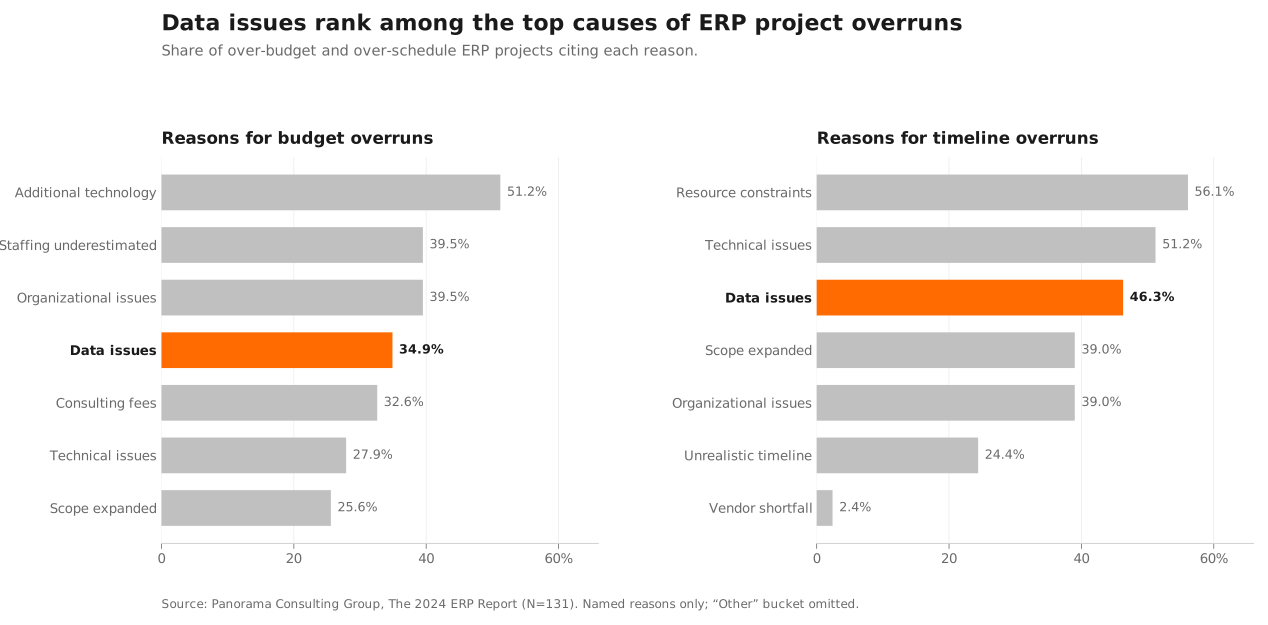
Two-panel bar chart titled 'Data issues rank among the top causes of ERP project overruns.' Left panel, reasons for budget overruns: Additional technology 51.2%, Staffing underestimated 39.5%, Organizational issues 39.5%, Data issues 34.9% highlighted in orange, Consulting fees 32.6%, Technical issues 27.9%, Scope expanded 25.6%. Right panel, reasons for timeline overruns: Resource constraints 56.1%, Technical issues 51.2%, Data issues 46.3% highlighted in orange, Scope expanded 39.0%, Organizational issues 39.0%, Unrealistic timeline 24.4%, Vendor shortfall 2.4%. Source: Panorama Consulting Group, The 2024 ERP Report.
7 min read

The mapping your ERP vendor never documented

In an ERP migration the export is easy. The hard part is the undocumented business logic the old system encoded over years, and recovering it before go-live.
erp-data-migrationerp-program-ownerdata-mappingerp-migrationreconciliationdata-integration
Read more
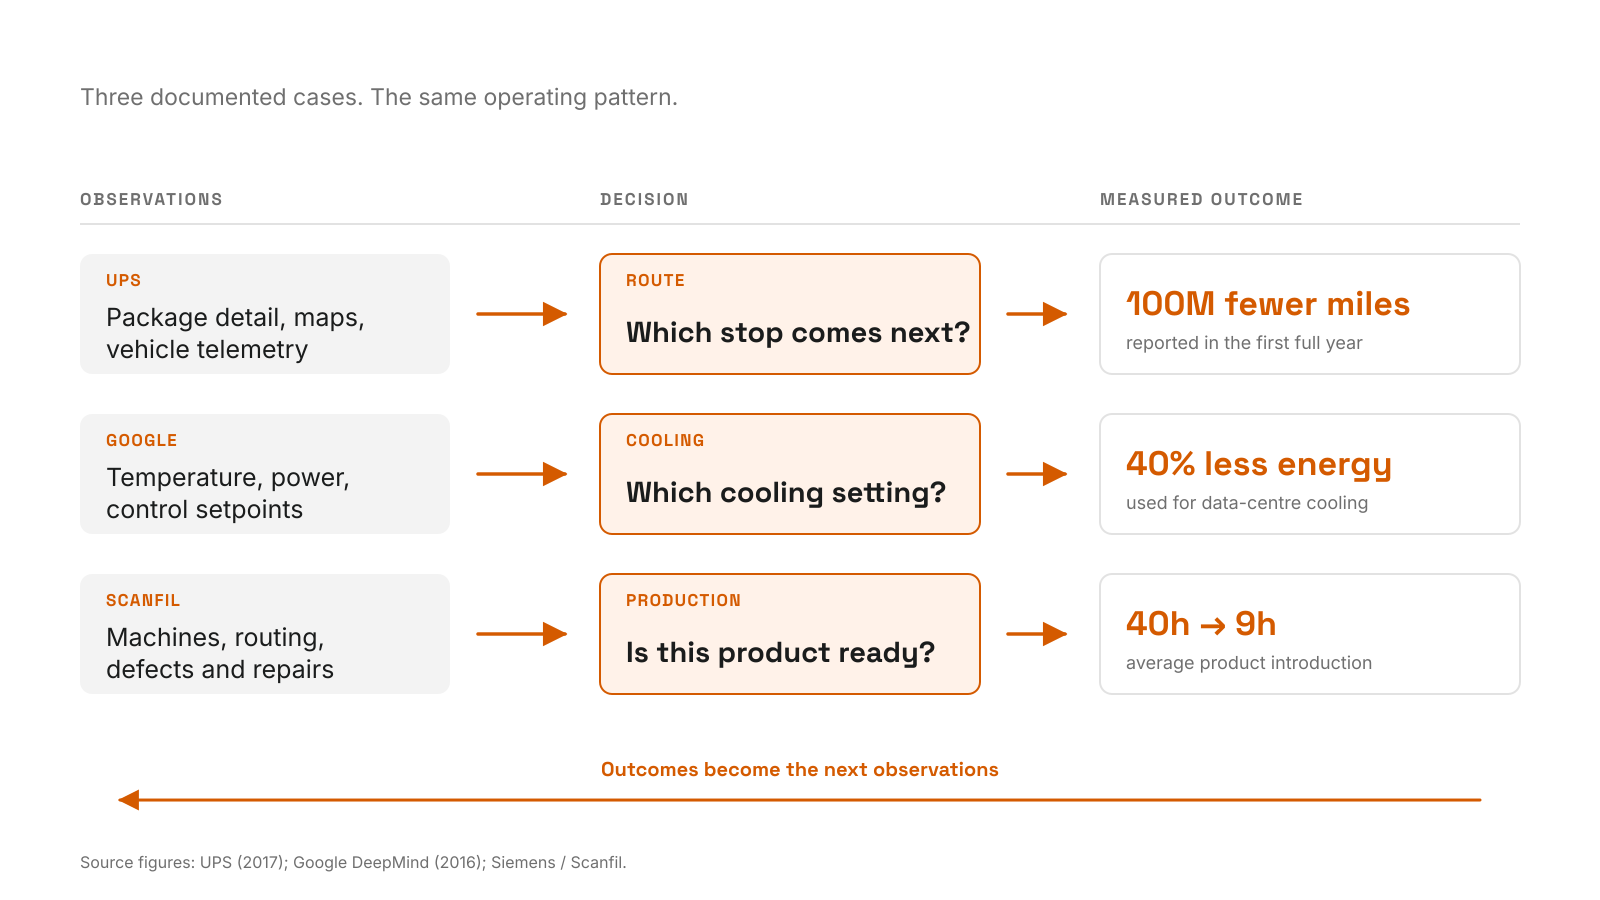
Three documented data-to-decision loops. UPS combines package, map, and vehicle data to choose delivery routes, reporting 100 million fewer miles. Google combines temperature, power, and setpoint data to choose cooling settings, reporting 40% less cooling energy. Scanfil combines machine, routing, and defect data to prepare production introductions, reducing the average from 40 hours to 9 hours. A feedback arrow shows outcomes becoming the next observations.
9 min read

Why data-driven decisions are hard to make routine

Reliable decisions depend on records from several operational systems arriving on time, retaining their meaning, and remaining available without a dedicated data team.
datadata integrationAIdecision making
Read more
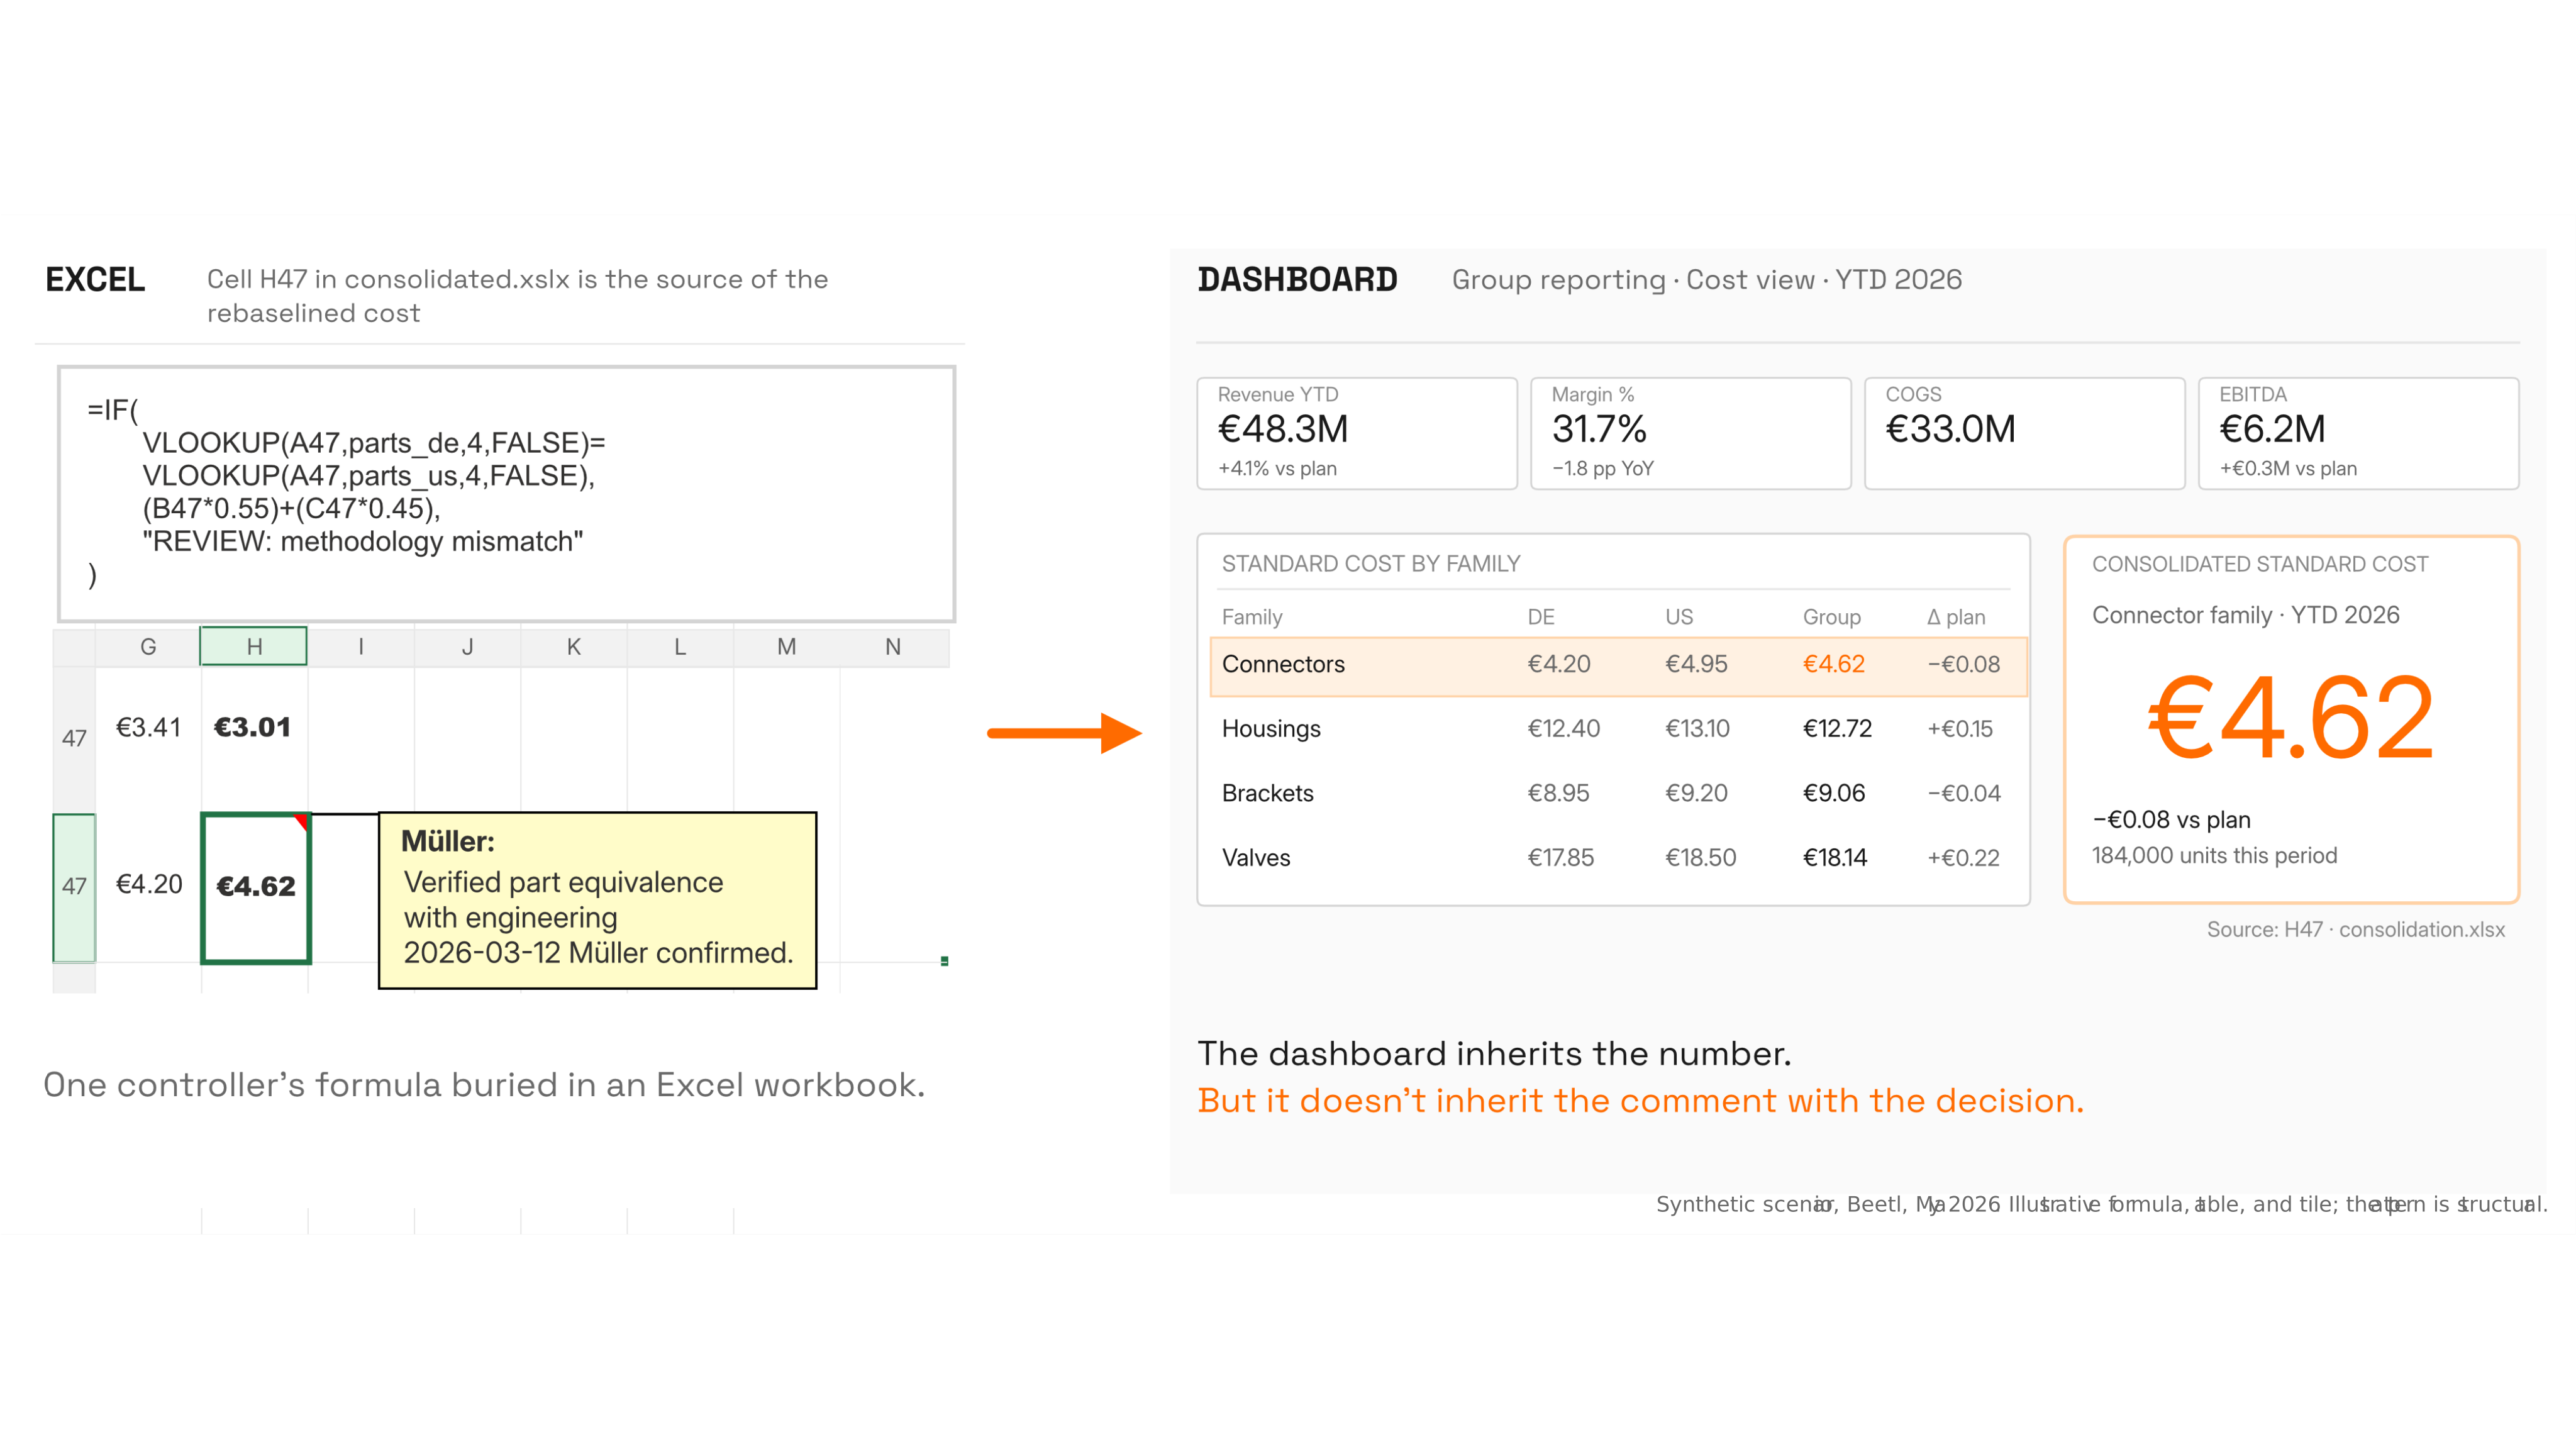
Two-panel cover. Left: cell H47 of consolidation.xlsx in the cost rebaselining sheet, an orange comment ribbon above the cell reading 'Verified part equivalence with engineering 2026-03-12, Müller confirmed', a multi-line IF/VLOOKUP formula below that returns €4.62. Right: a Power BI group reporting dashboard for YTD 2026 with a top strip of headline KPIs (Revenue €48.3M, Margin 31.7%, COGS €33.0M, EBITDA €6.2M), a 'Standard cost by family' table where the Connector family row is highlighted in orange and shows DE €4.20, US €4.95, Group €4.62, and a focal card labelled 'Consolidated standard cost - Connector family' displaying €4.62 with a 'minus €0.08 vs plan' and '184,000 units this period' annotation. Below the dashboard: 'Inherits the number. Doesn't inherit the comment.' An orange arrow labelled 'draws from' connects the workbook formula to the dashboard.
8 min read

The Excel-and-Power-BI handoff that holds post-merger reporting together

The post-merger Excel workbook holds the consolidation together, but the human decisions baked into its formulas never reach the Power BI layer above.
post-merger-reportingcontrollerexcelpower-bimanufacturing-data-integrationaudit-trailconsolidation
Read more
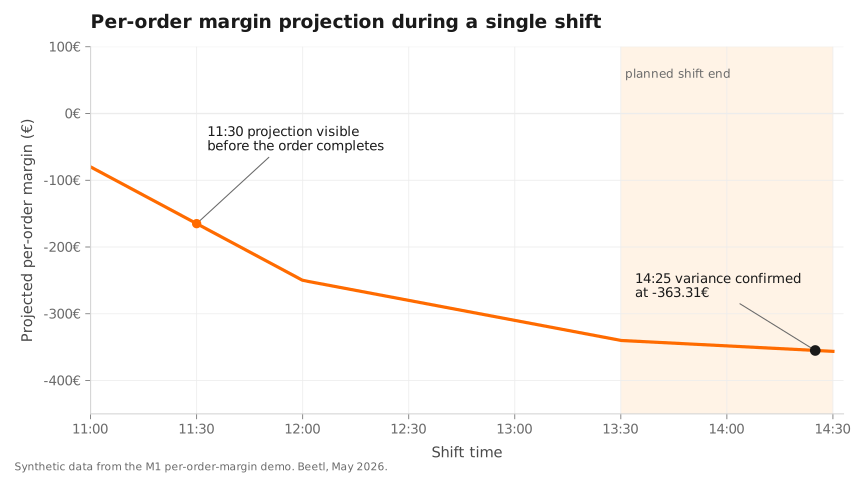
Projected per-order margin during a single shift on a four-line packaging plant. Starts near zero at 11:00, deepens through 12:00 as the cycle-time drift on Müller-Pharma's blister-card line consolidates, levels around -340€ through the planned shift end at 13:30, and is confirmed at -363.31€ when the order completes 55 minutes late at 14:25.
7 min read

Can you see per-order margin while the shift is still running?

Plants learn a shift's profitability at month-end, two weeks late. What it would take to compute per-order margin live across PLC, MES, ERP, and labor data.
manufacturingdatamarginreal-time
Read more
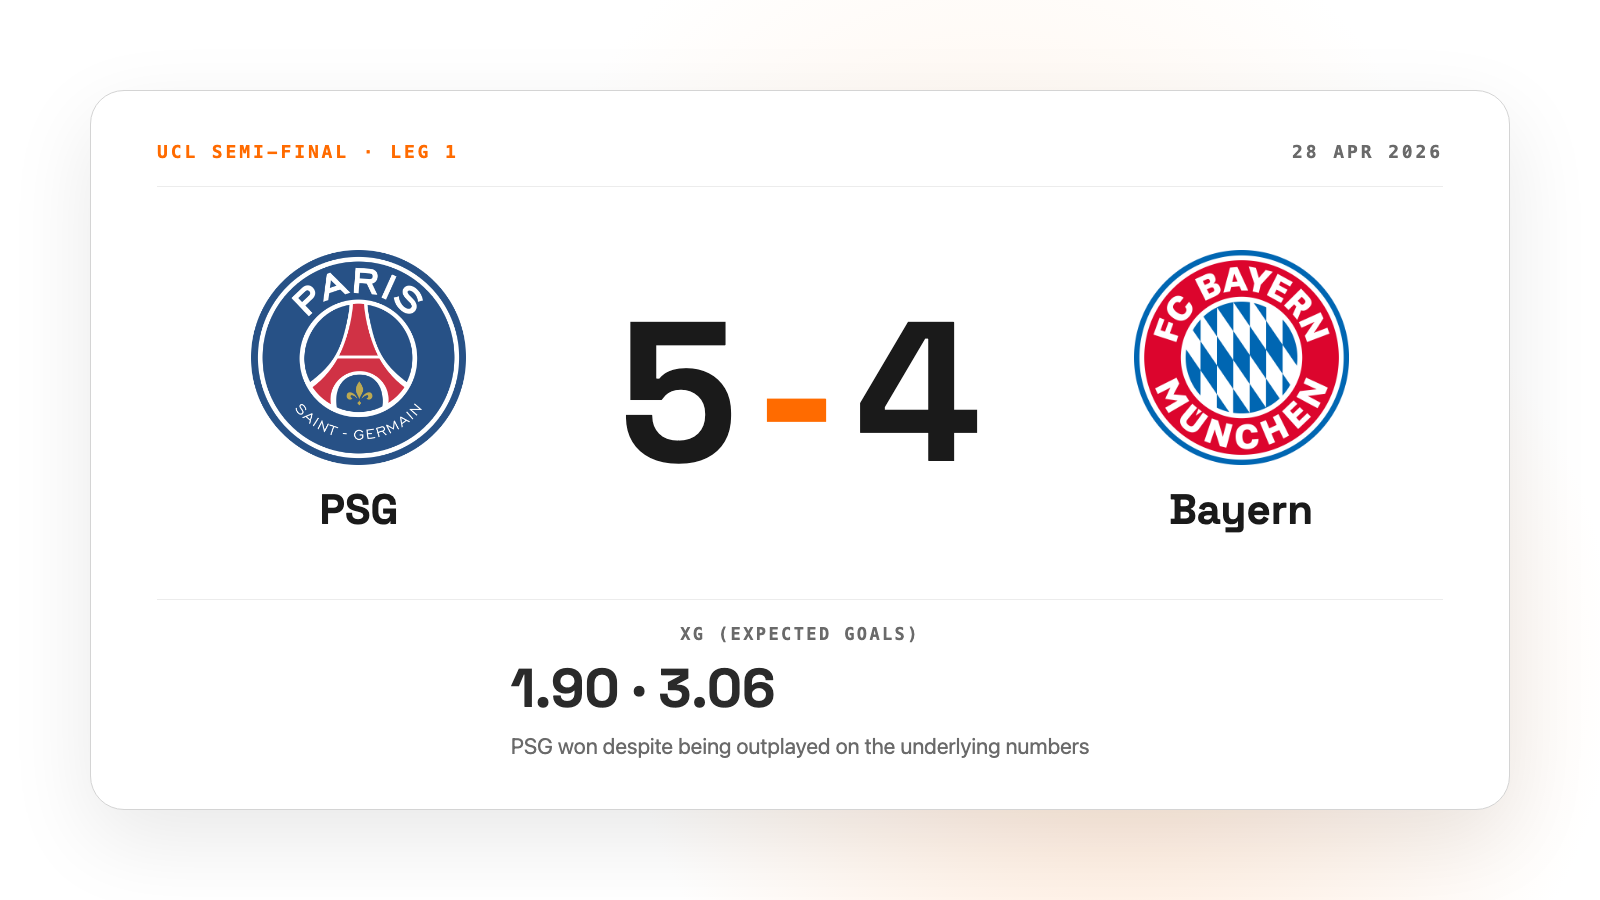
PSG 5-4 Bayern matchup data card showing PSG won despite Bayern leading expected goals 3.06 to 1.90.
11 min read

Anatomy of a 5-4 Champions League Thriller: A Football Data Case Study

A football data case study on PSG vs Bayern, expected threat, metric choice, and why the real value is when you can ask the 2nd, 3rd, and 4th question cheaply.
football analyticsdatabuilding in public
Read more
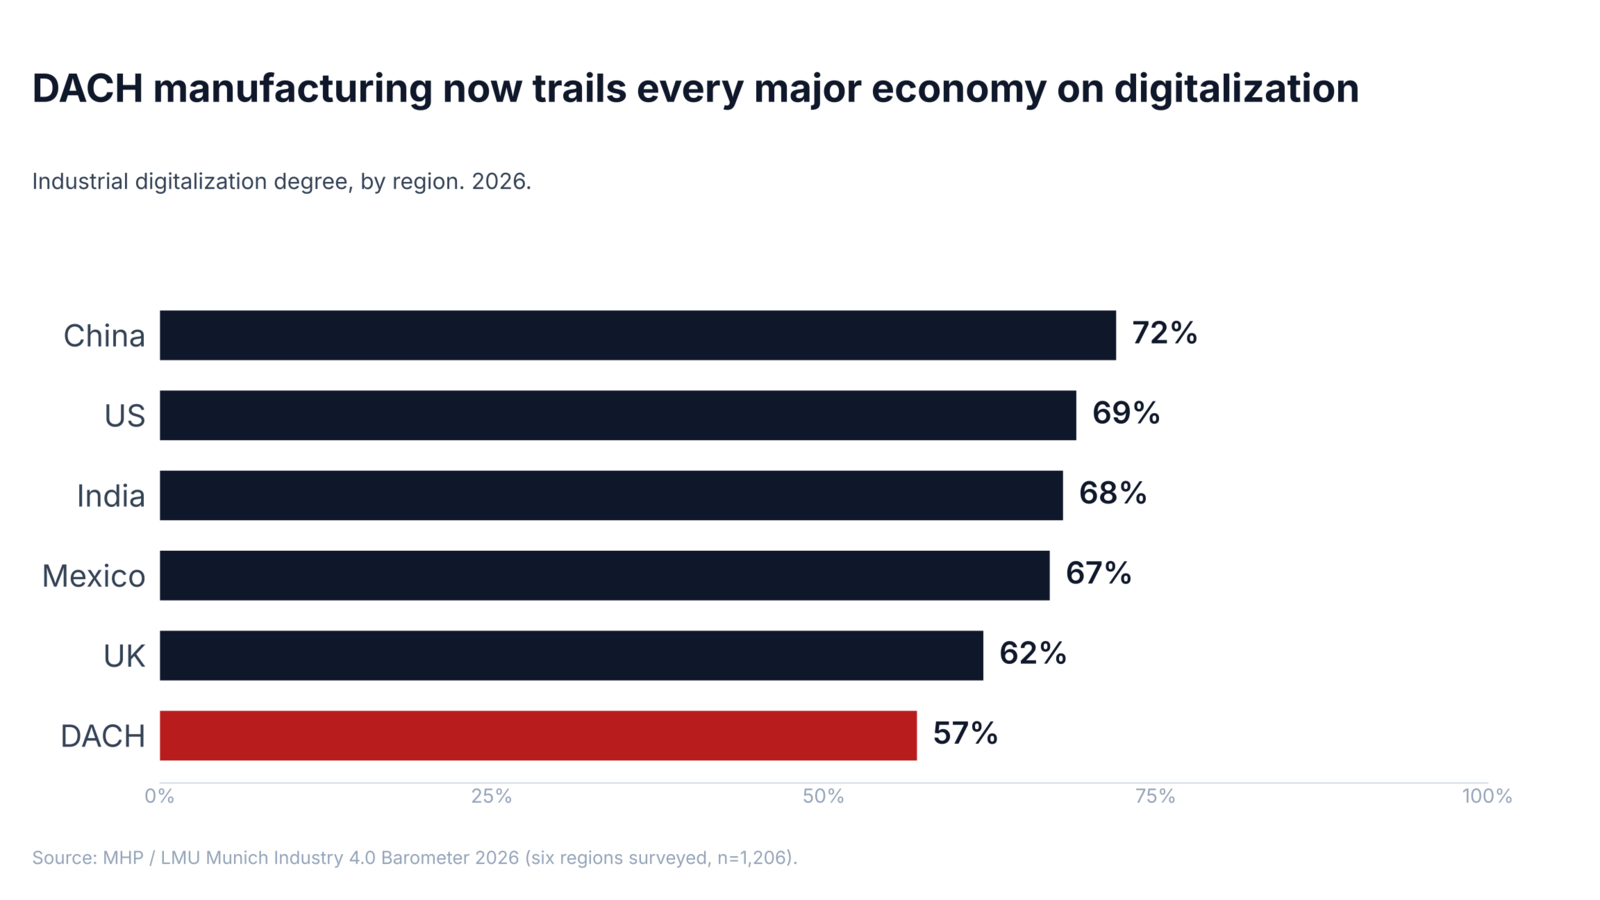
Industrial digitalization by region in 2026: China 72%, US 69%, India 68%, Mexico 67%, UK 62%, DACH 57%. DACH ranks last among the six regions surveyed by MHP / LMU Munich.
10 min read

DACH manufacturing now trails every major economy on digitalization

DACH industrial digitalization stagnated at 57% while every other surveyed region pulled ahead. Why the obvious solutions don't fit Mittelstand manufacturers.

manufacturingmittelstanddata
Read more