Blog
Notes on custom data integration: connecting systems, keeping mappings explicit, and keeping the pipeline working after the first successful run.
Topics
Browse posts by focus area.
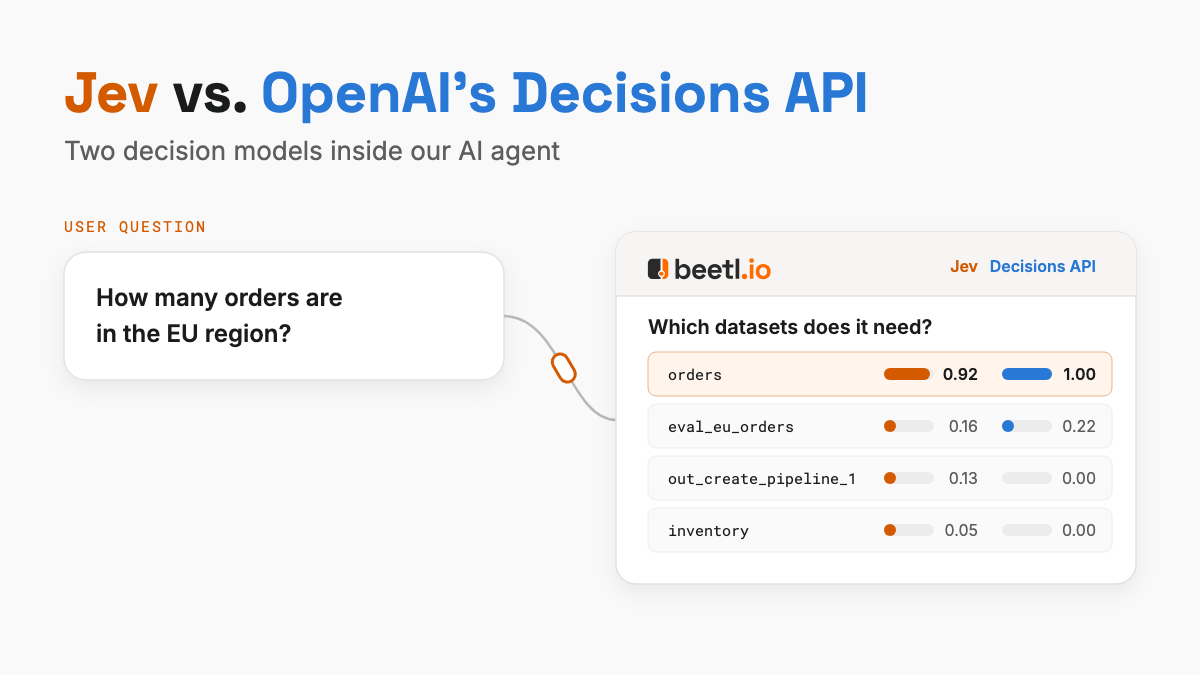
What we learned putting decision models inside a production AI agent
We wired two decision models, TypeSafe's Jev and OpenAI's Decisions API, into Beetl's assistant and automations, then measured them: where they helped, where they broke, and how they differ.
How we wrote 20 integrations in one day
The design behind Connect, and how shared infrastructure makes custom integrations easier to build.
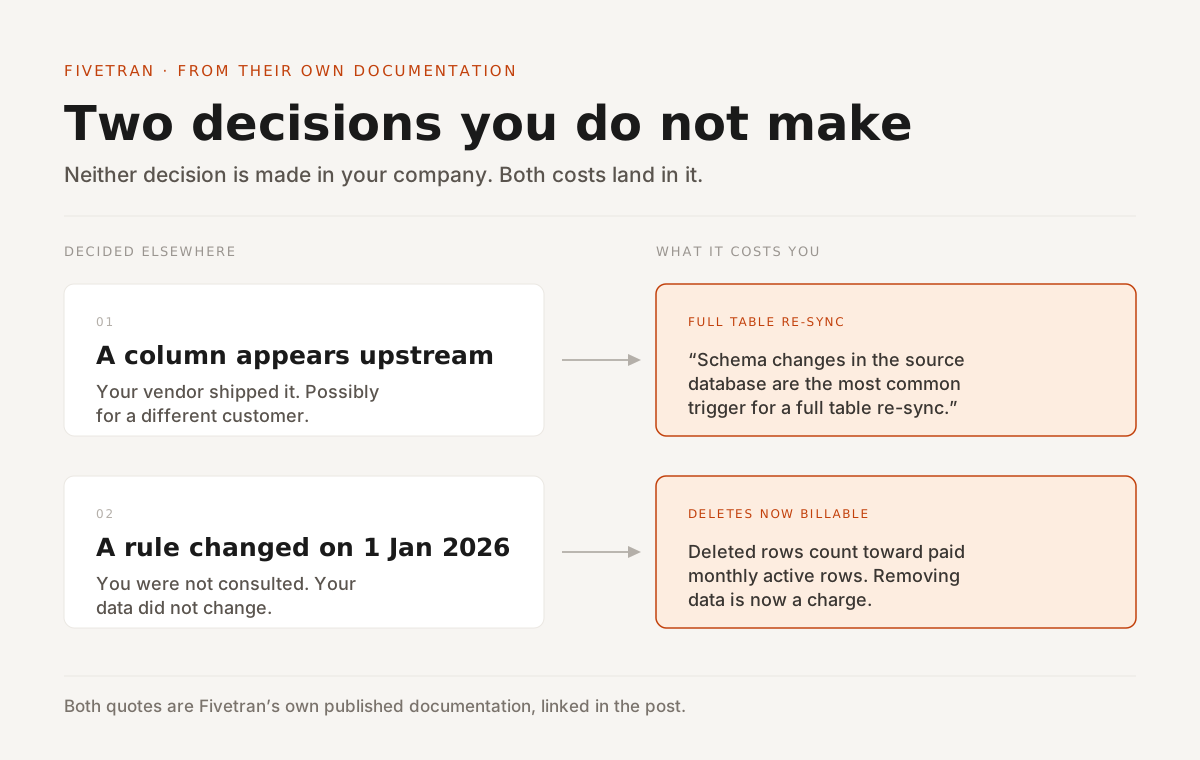
Fivetran charges you to delete data
Since 1 January 2026 deleted rows count toward paid monthly active rows. That change, and what actually triggers a full table re-sync, are both documented by Fivetran.
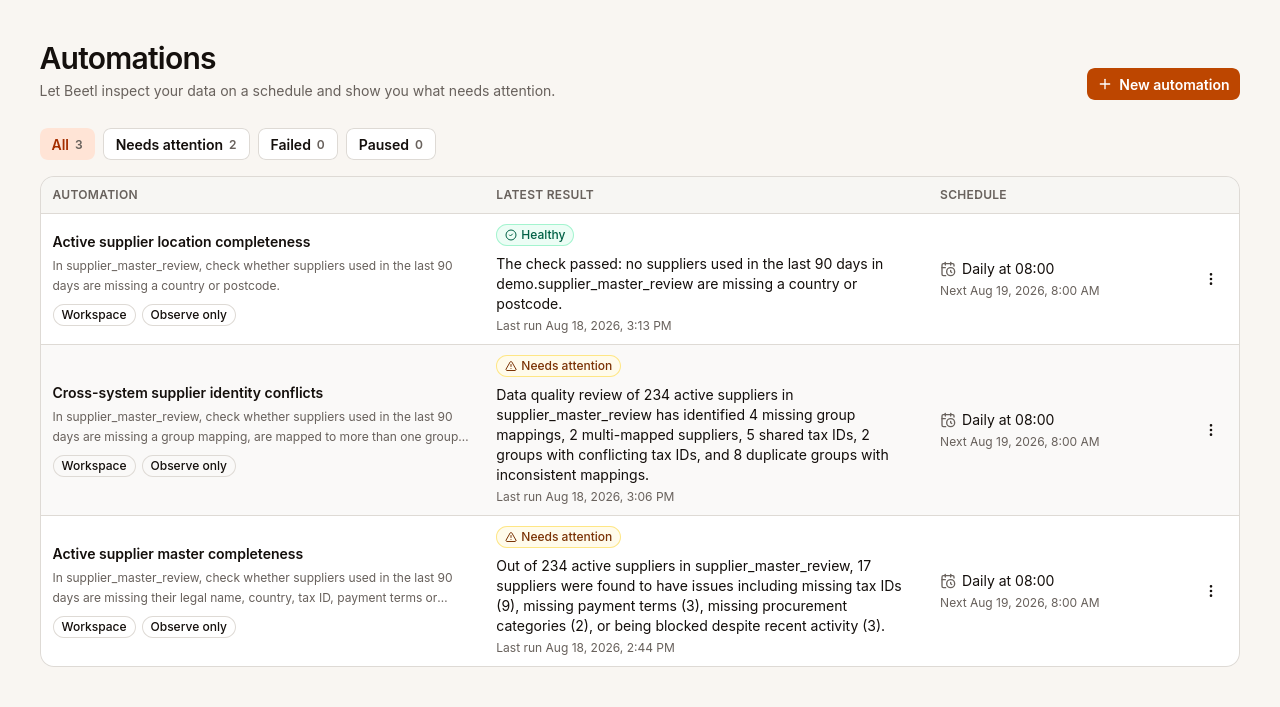
AI Automations for the messy half of data quality
Use AI Automations to investigate recurring data-quality questions and see the evidence behind every result.
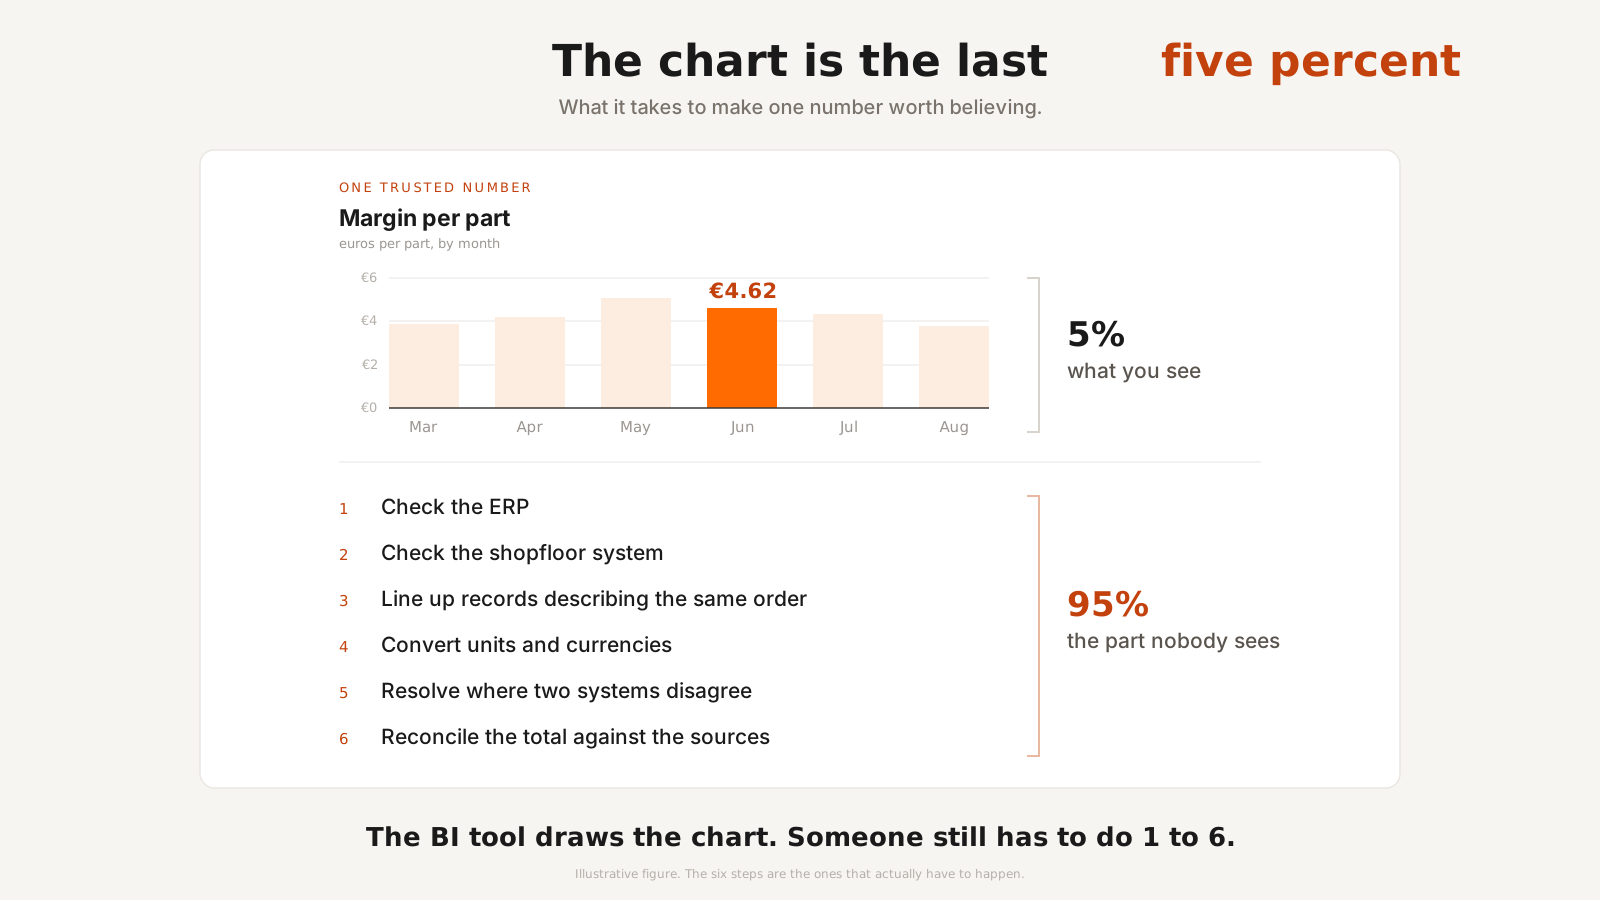
You already have BI. What you're missing is trustworthy joined data.
If you have a BI tool and still cannot trust your reporting, the tool is fine. The work that is missing sits upstream of the chart.
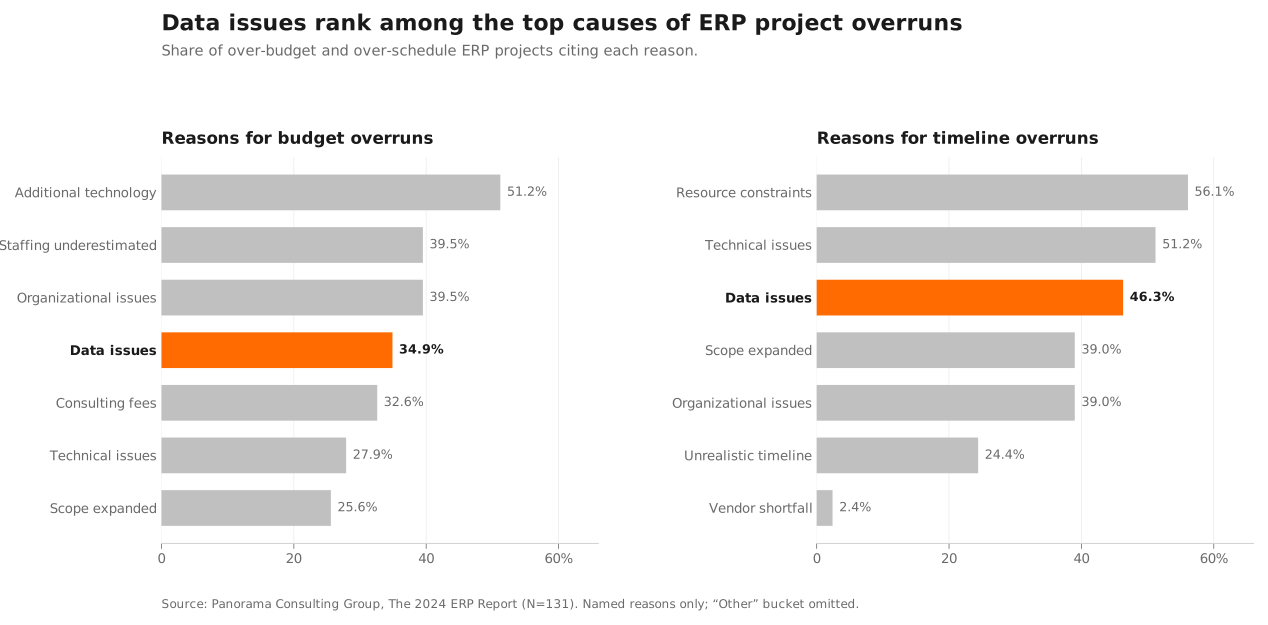
The mapping your ERP vendor never documented
In an ERP migration the export is easy. The hard part is the undocumented business logic the old system encoded over years, and recovering it before go-live.
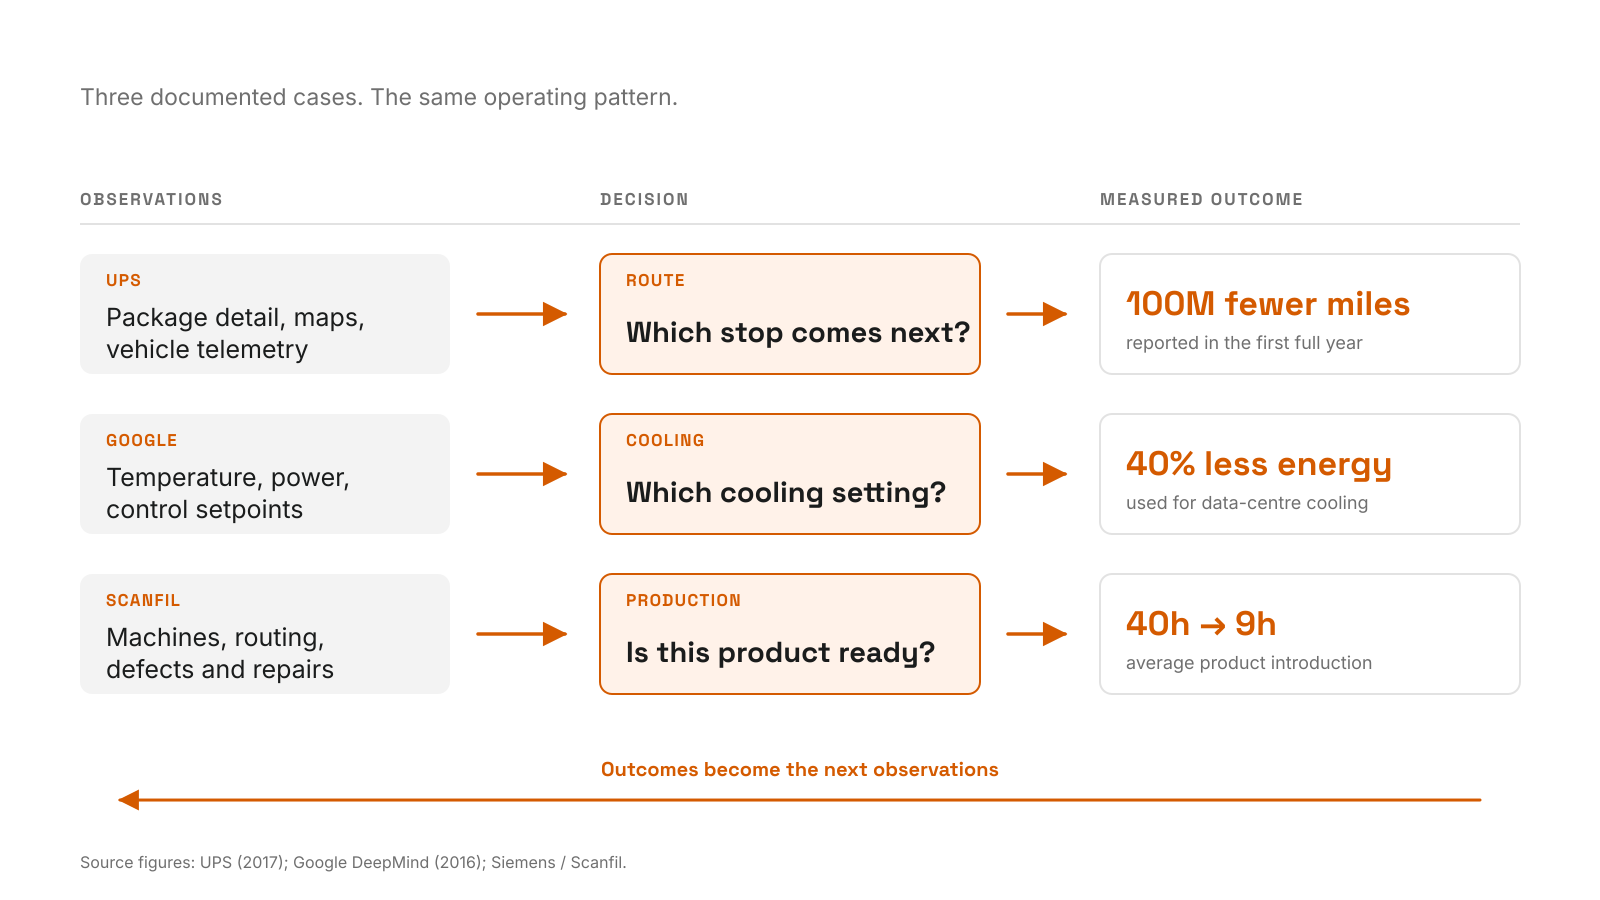
Why data-driven decisions are hard to make routine
Reliable decisions depend on records from several operational systems arriving on time, retaining their meaning, and remaining available without a dedicated data team.
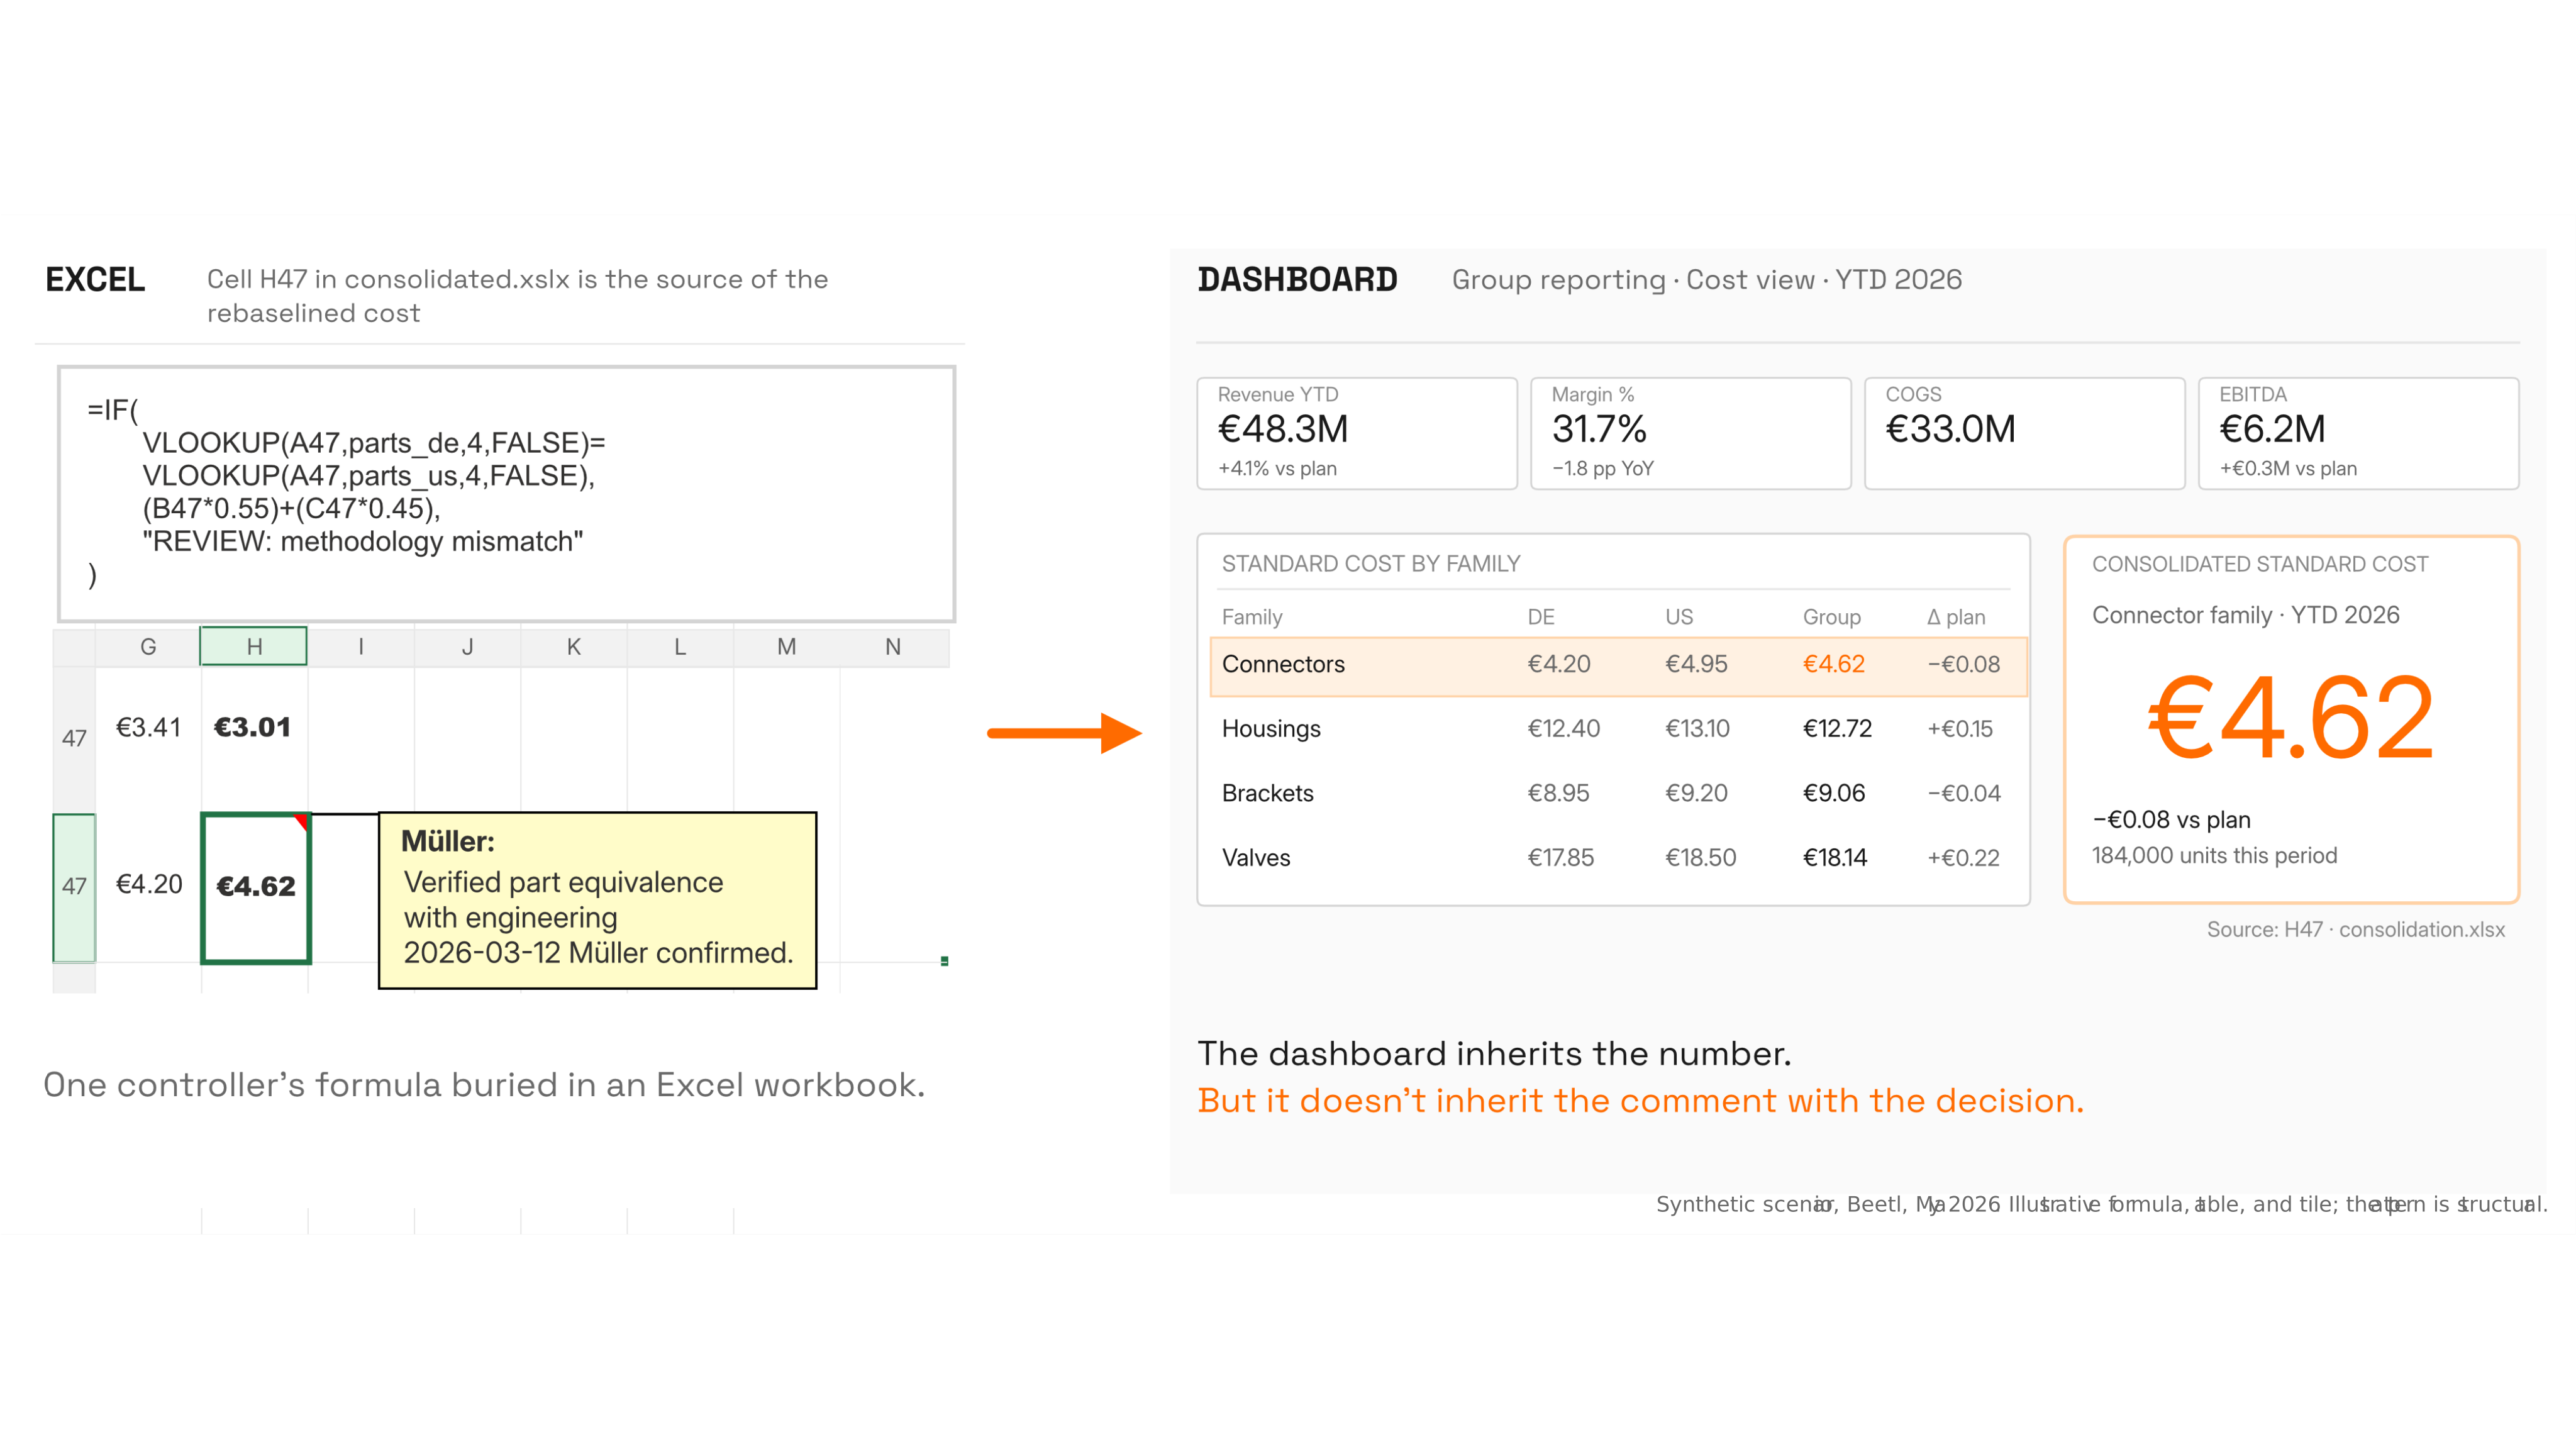
The Excel-and-Power-BI handoff that holds post-merger reporting together
The post-merger Excel workbook holds the consolidation together, but the human decisions baked into its formulas never reach the Power BI layer above.
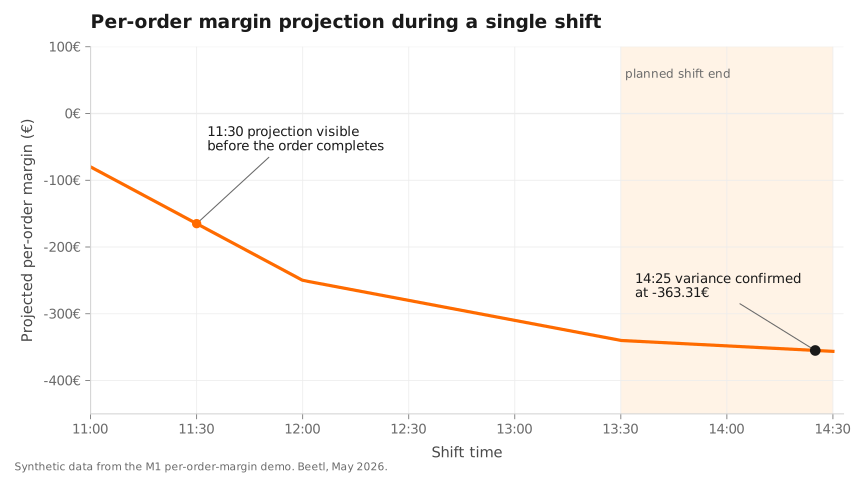
Can you see per-order margin while the shift is still running?
Plants learn a shift's profitability at month-end, two weeks late. What it would take to compute per-order margin live across PLC, MES, ERP, and labor data.
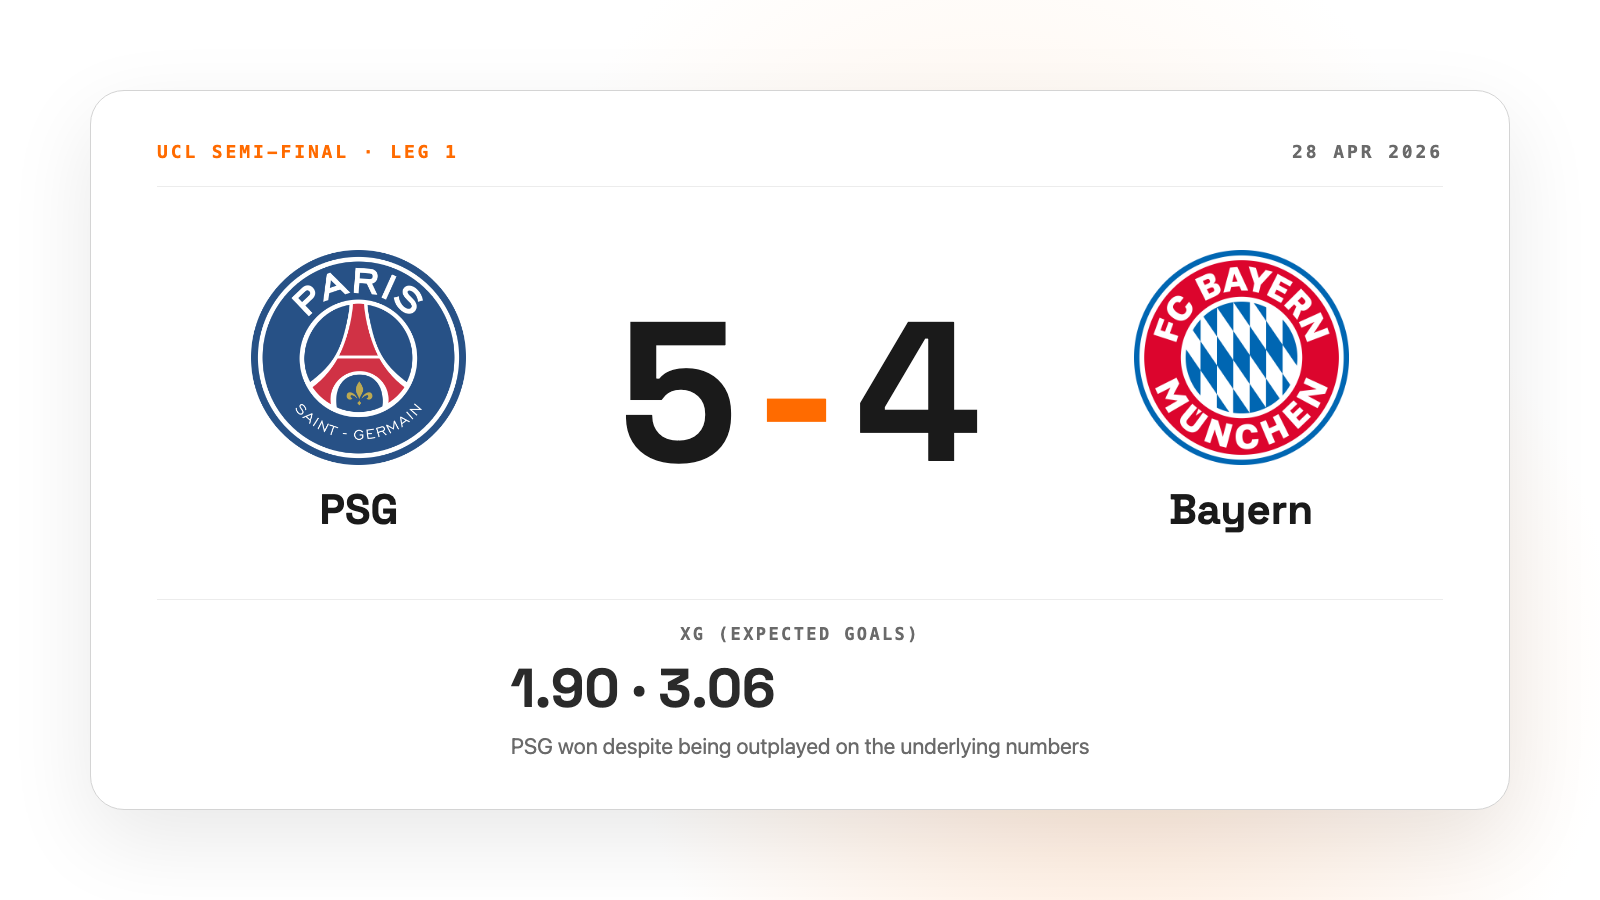
Anatomy of a 5-4 Champions League Thriller: A Football Data Case Study
A football data case study on PSG vs Bayern, expected threat, metric choice, and why the real value is when you can ask the 2nd, 3rd, and 4th question cheaply.
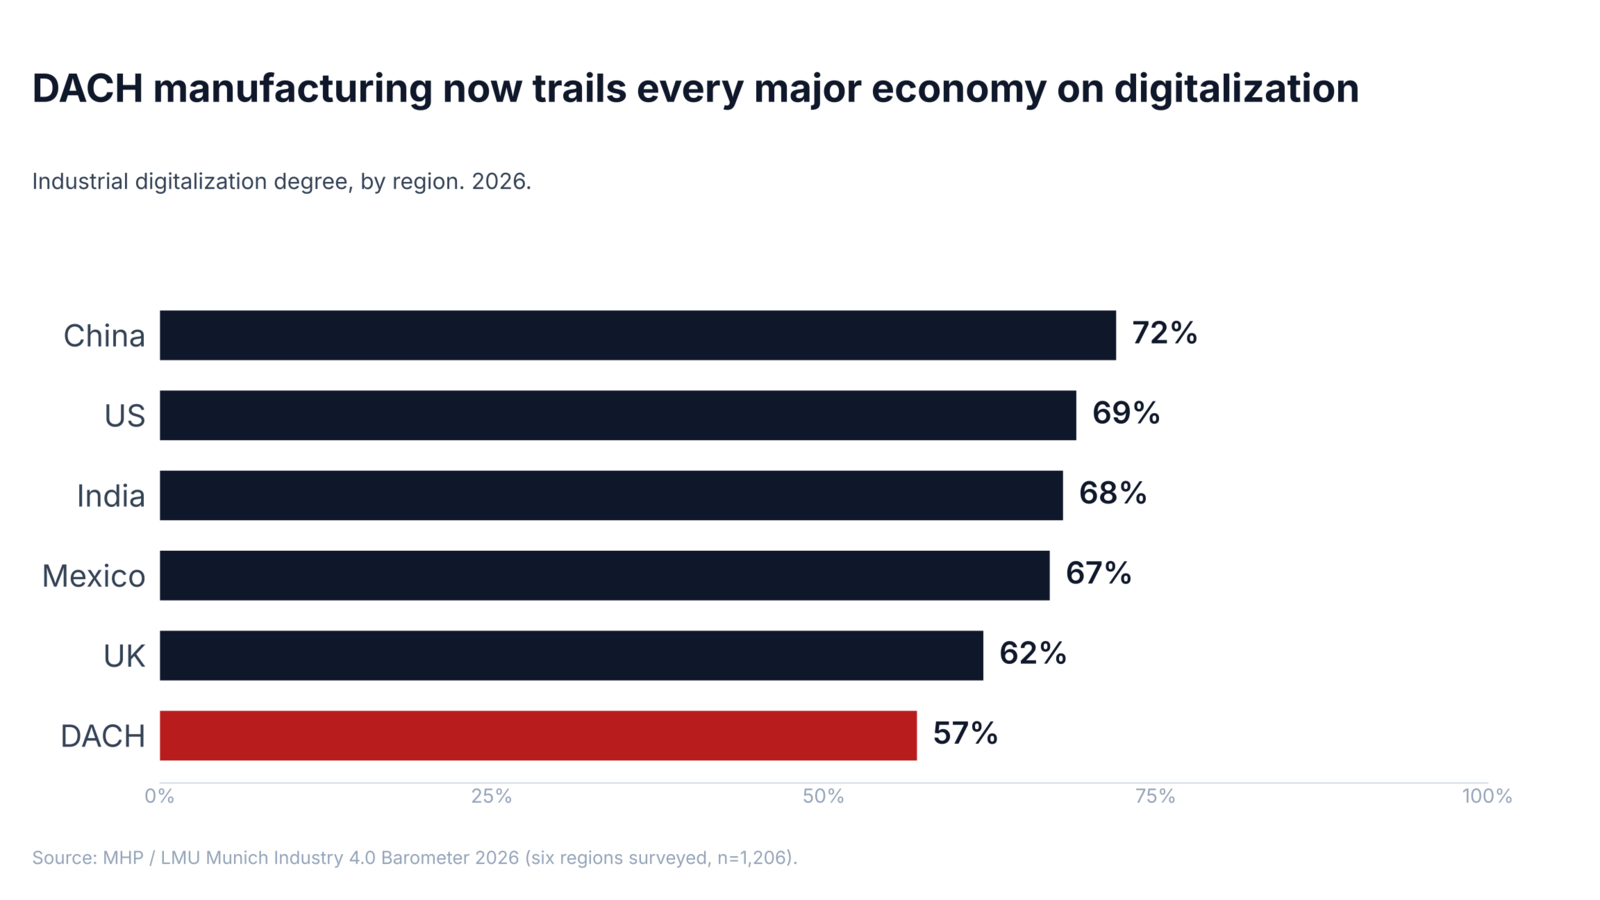
DACH manufacturing now trails every major economy on digitalization
DACH industrial digitalization stagnated at 57% while every other surveyed region pulled ahead. Why the obvious solutions don't fit Mittelstand manufacturers.
No posts for this topic.