
The actual profit margin of a manufacturing order in most cases is decided based on what happens during the shift, but almost no plant can see it while the shift is running.
The shop floor knows whether the line is up, whether the operator is on station, and whether the part counters are advancing. The controller's office knows what an hour of overtime costs and what an order was quoted at. Both pieces exist. They just live in different systems on different update cadences, and they are usually only joined at month-end close, two weeks after anyone could have done anything about a bad day.
This post is a stab at what it would take to close that gap.
Per-order margin, for anyone whose week doesn't involve it, is the contribution margin of a single manufacturing order after the labor, machine time, materials, and overhead actually consumed by that order are subtracted from the price the customer paid. The standard finance treatment computes it monthly from posted journal entries. The interesting question is whether you can compute it hourly.
The industry is right that real-time data matters
The recent industry discourse around this makes the case that real-time operational data is itself a margin lever. Grant Thornton's 2026 manufacturing piece on hidden margin loss is one example (Grant Thornton, 2026); ManufacturingTomorrow's "margin blind spot" article is another (ManufacturingTomorrow, Feb 2026). Both arguments are correct as far as they go. Production changeovers, supplier substitutions, and expedited shipments can move profitability within hours, and financial reporting that catches up two weeks later catches up too late.
So we agree on the premise. Where this writing tends to fall short is on the implementation. "Get real-time data" is offered as if real-time data were the missing piece. Most plants have real-time data. The PLCs emit cycle observations every two seconds. The MES emits events when an order starts and completes. The ERP holds the cost master and the contract price. The time-clock system records who clocked in and out. The pipes are flowing with fresh data.
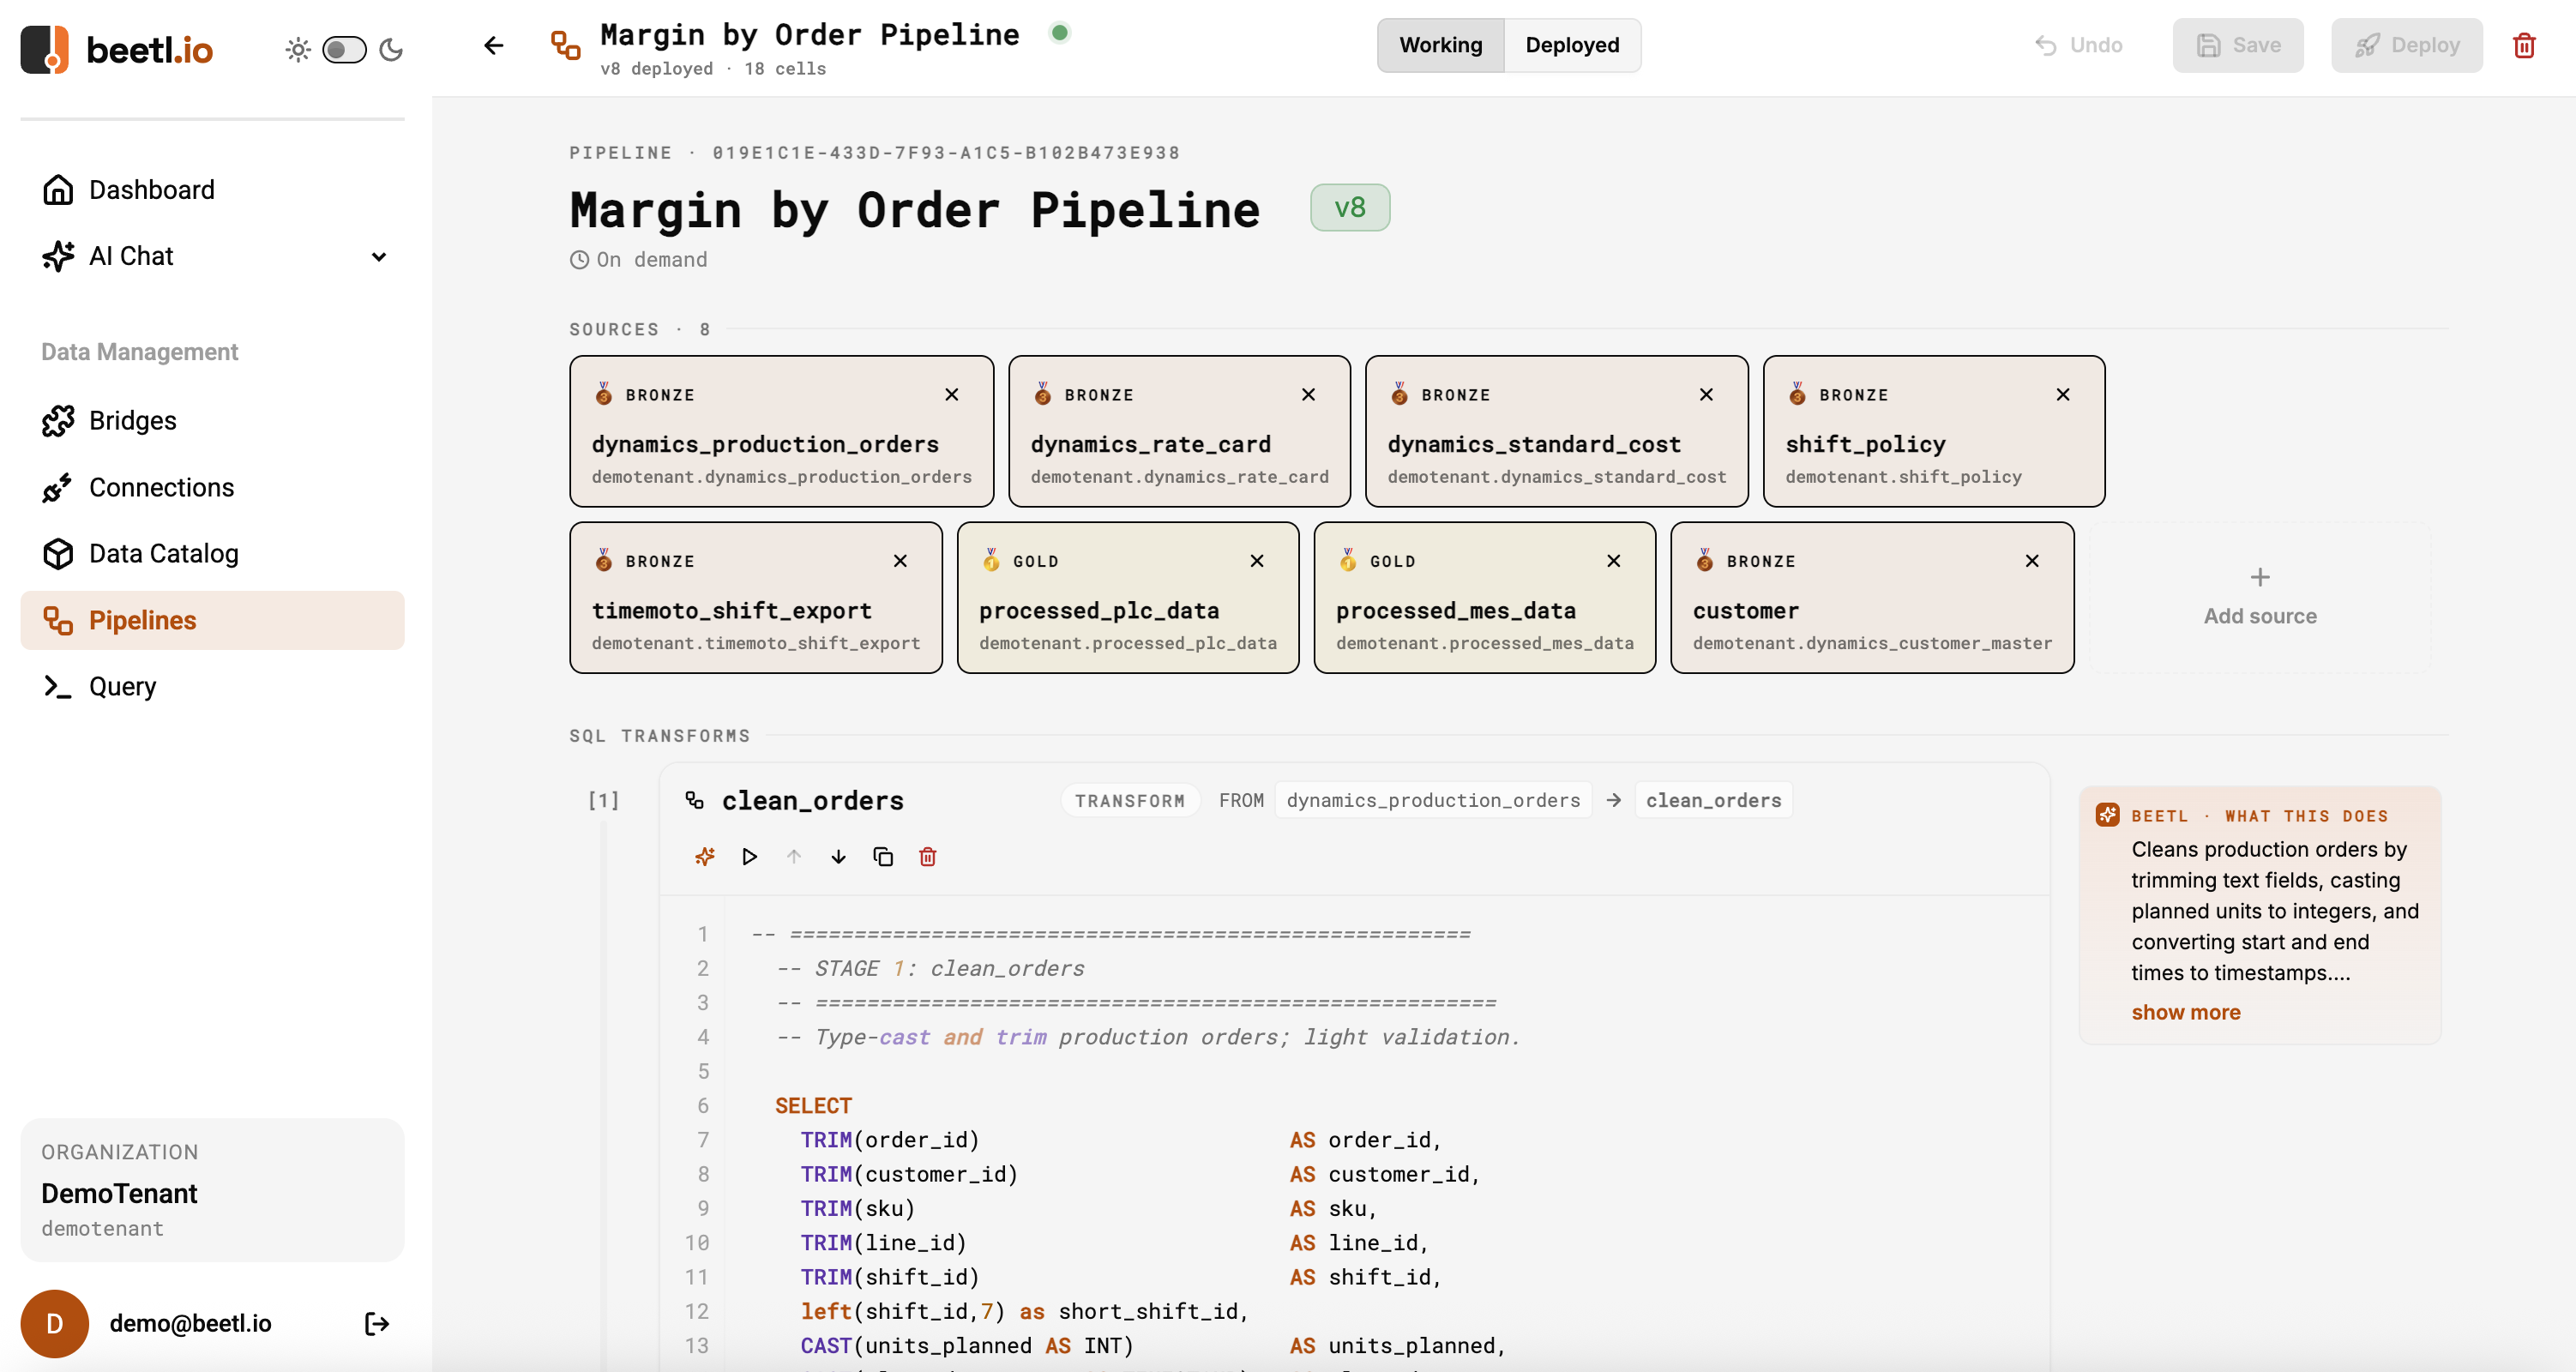
What is missing is a semantic layer that turns all of that into a single number a shift supervisor can read.
The semantic join is the missing layer
In plain words, you can compute live per-order margin by:
- Capturing the cycle events being emitted by the line.
- Looking up which order is in production and computing how long each part is taking against the standard cycle time for that order's material.
- Multiplying the time variance by the labor rate of the operator currently clocked in plus the machine rate to get the cost.
- Calculating the net margin based on the computed time variance and the unit price on the order.
Now repeat that continuously.
Reading the above computation carefully will reveal the catch. There are five sources of truth in it, three update cadences, and four foreign keys that are not foreign keys in any system. The PLC does not know what order is running. The MES knows the order but not the labor rate. The cost master knows the labor rate but not who is on shift. None of the systems individually can produce the answer. The answer only exists in the join.
This is where most "real-time analytics for manufacturing" projects either stall or quietly settle for a less interesting metric like OEE. OEE is a fine thing to measure, and it's easier because it only requires one system. Per-order margin is what the controller actually wants, and it's hard for the same reason it's interesting.
What this looks like in a real shift
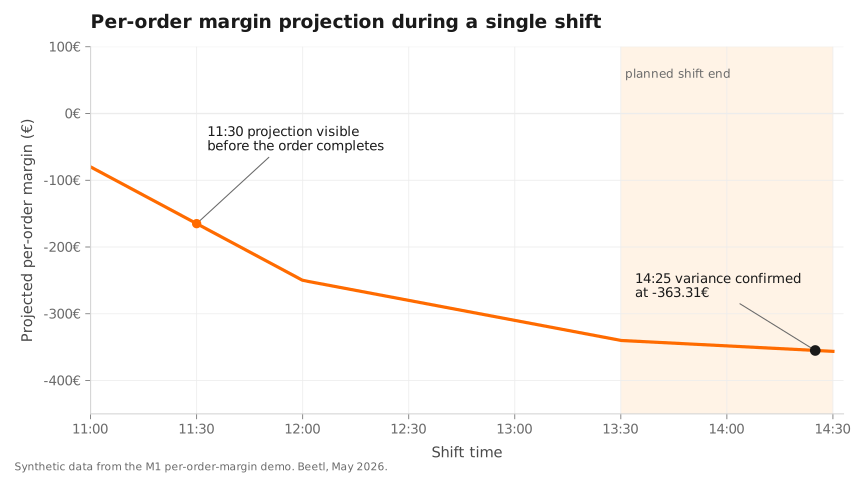
The chart at the top of this post is taken from a single shift on a four-line packaging plant, simulated from the preconditions we use internally to validate this calculation. Müller-Pharma's blister-card line is bleeding 14% over standard cycle time. By 11:30am the projection has consolidated: this order is on track for a current margin variance of about -363€. At 14:25 the order would finish 55 minutes late, and the projection is confirmed by the actual cost run at -363.31€, attributable in roughly equal parts to material scrap, overtime premiums, and controllable efficiency loss.
The interesting line in that story is not the confirmation at 14:25. Finance would have caught that in due course. The interesting line is the 11:30 projection. A shift supervisor looking at this number at 11:30 has the option of pulling a second operator onto the line, re-staging the order, or accepting the variance and pricing the next quote accordingly. By 14:25 the only available option is to file the variance.
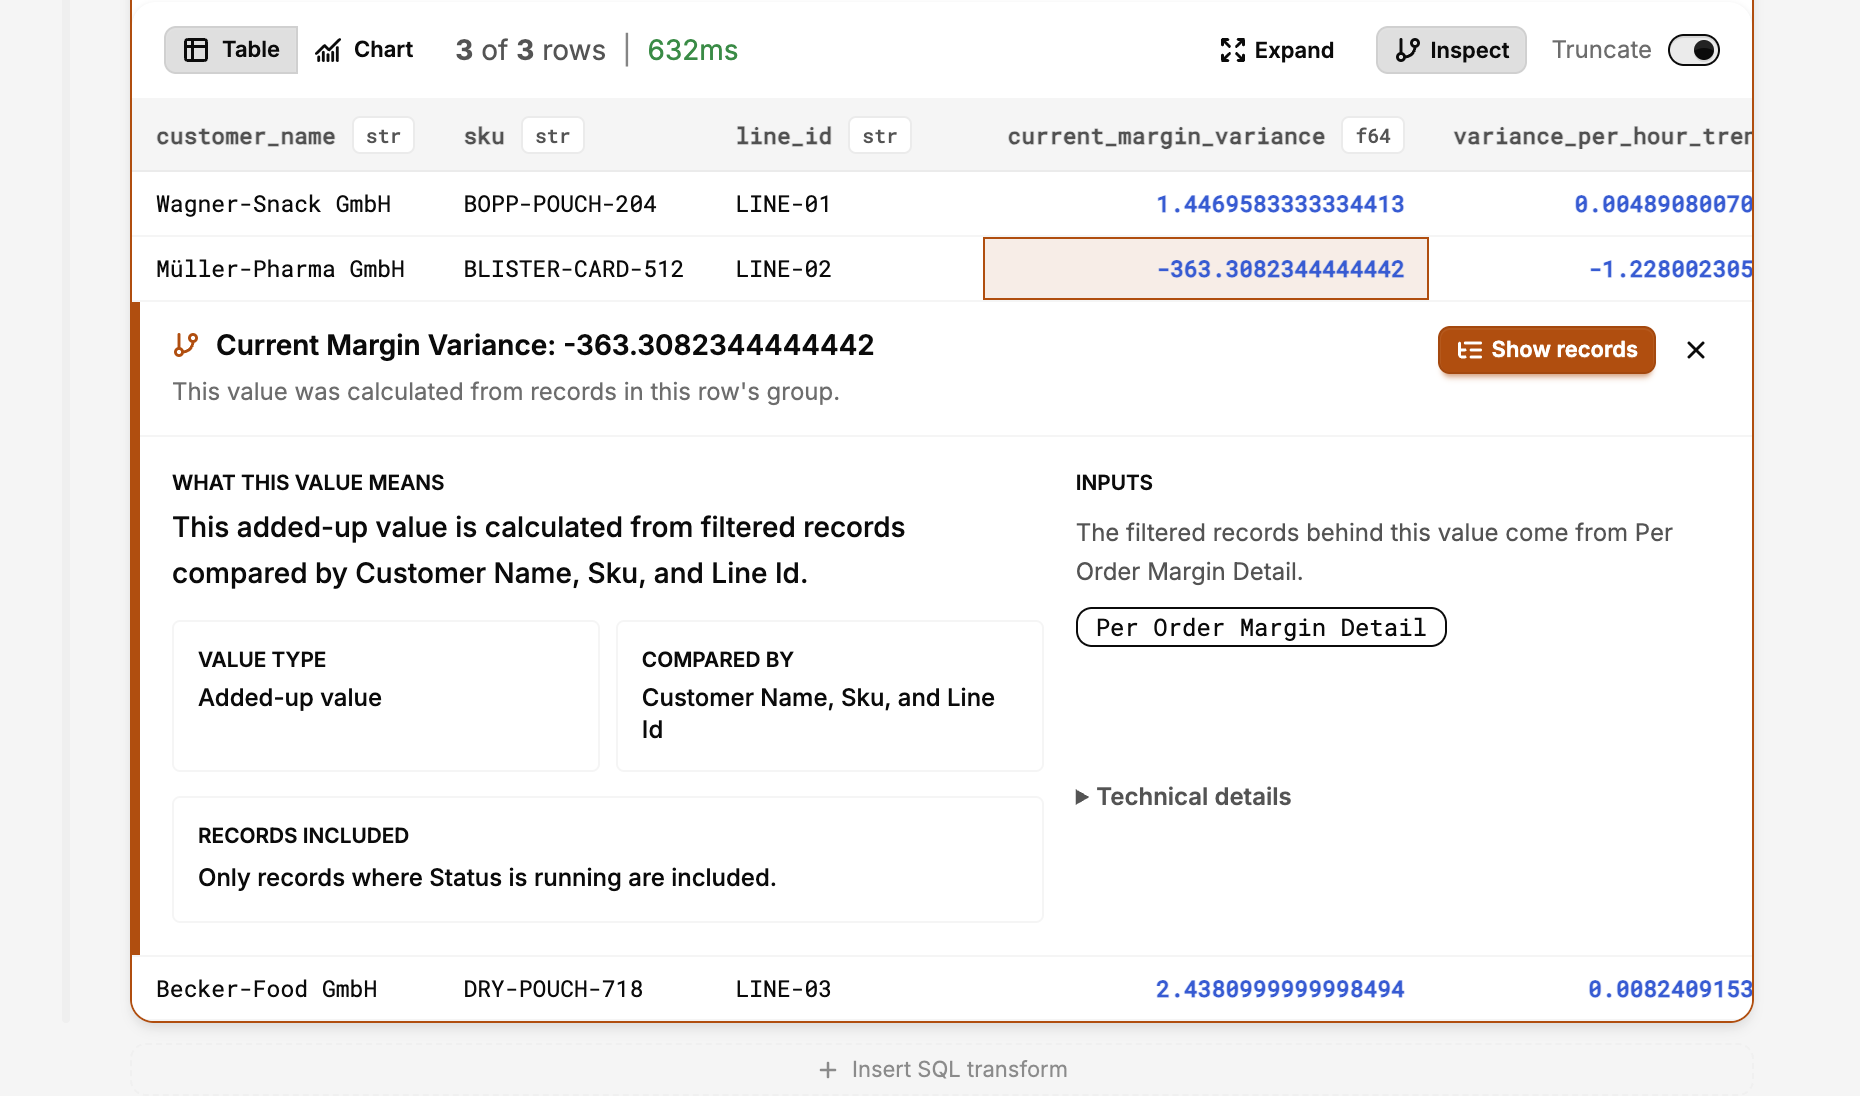
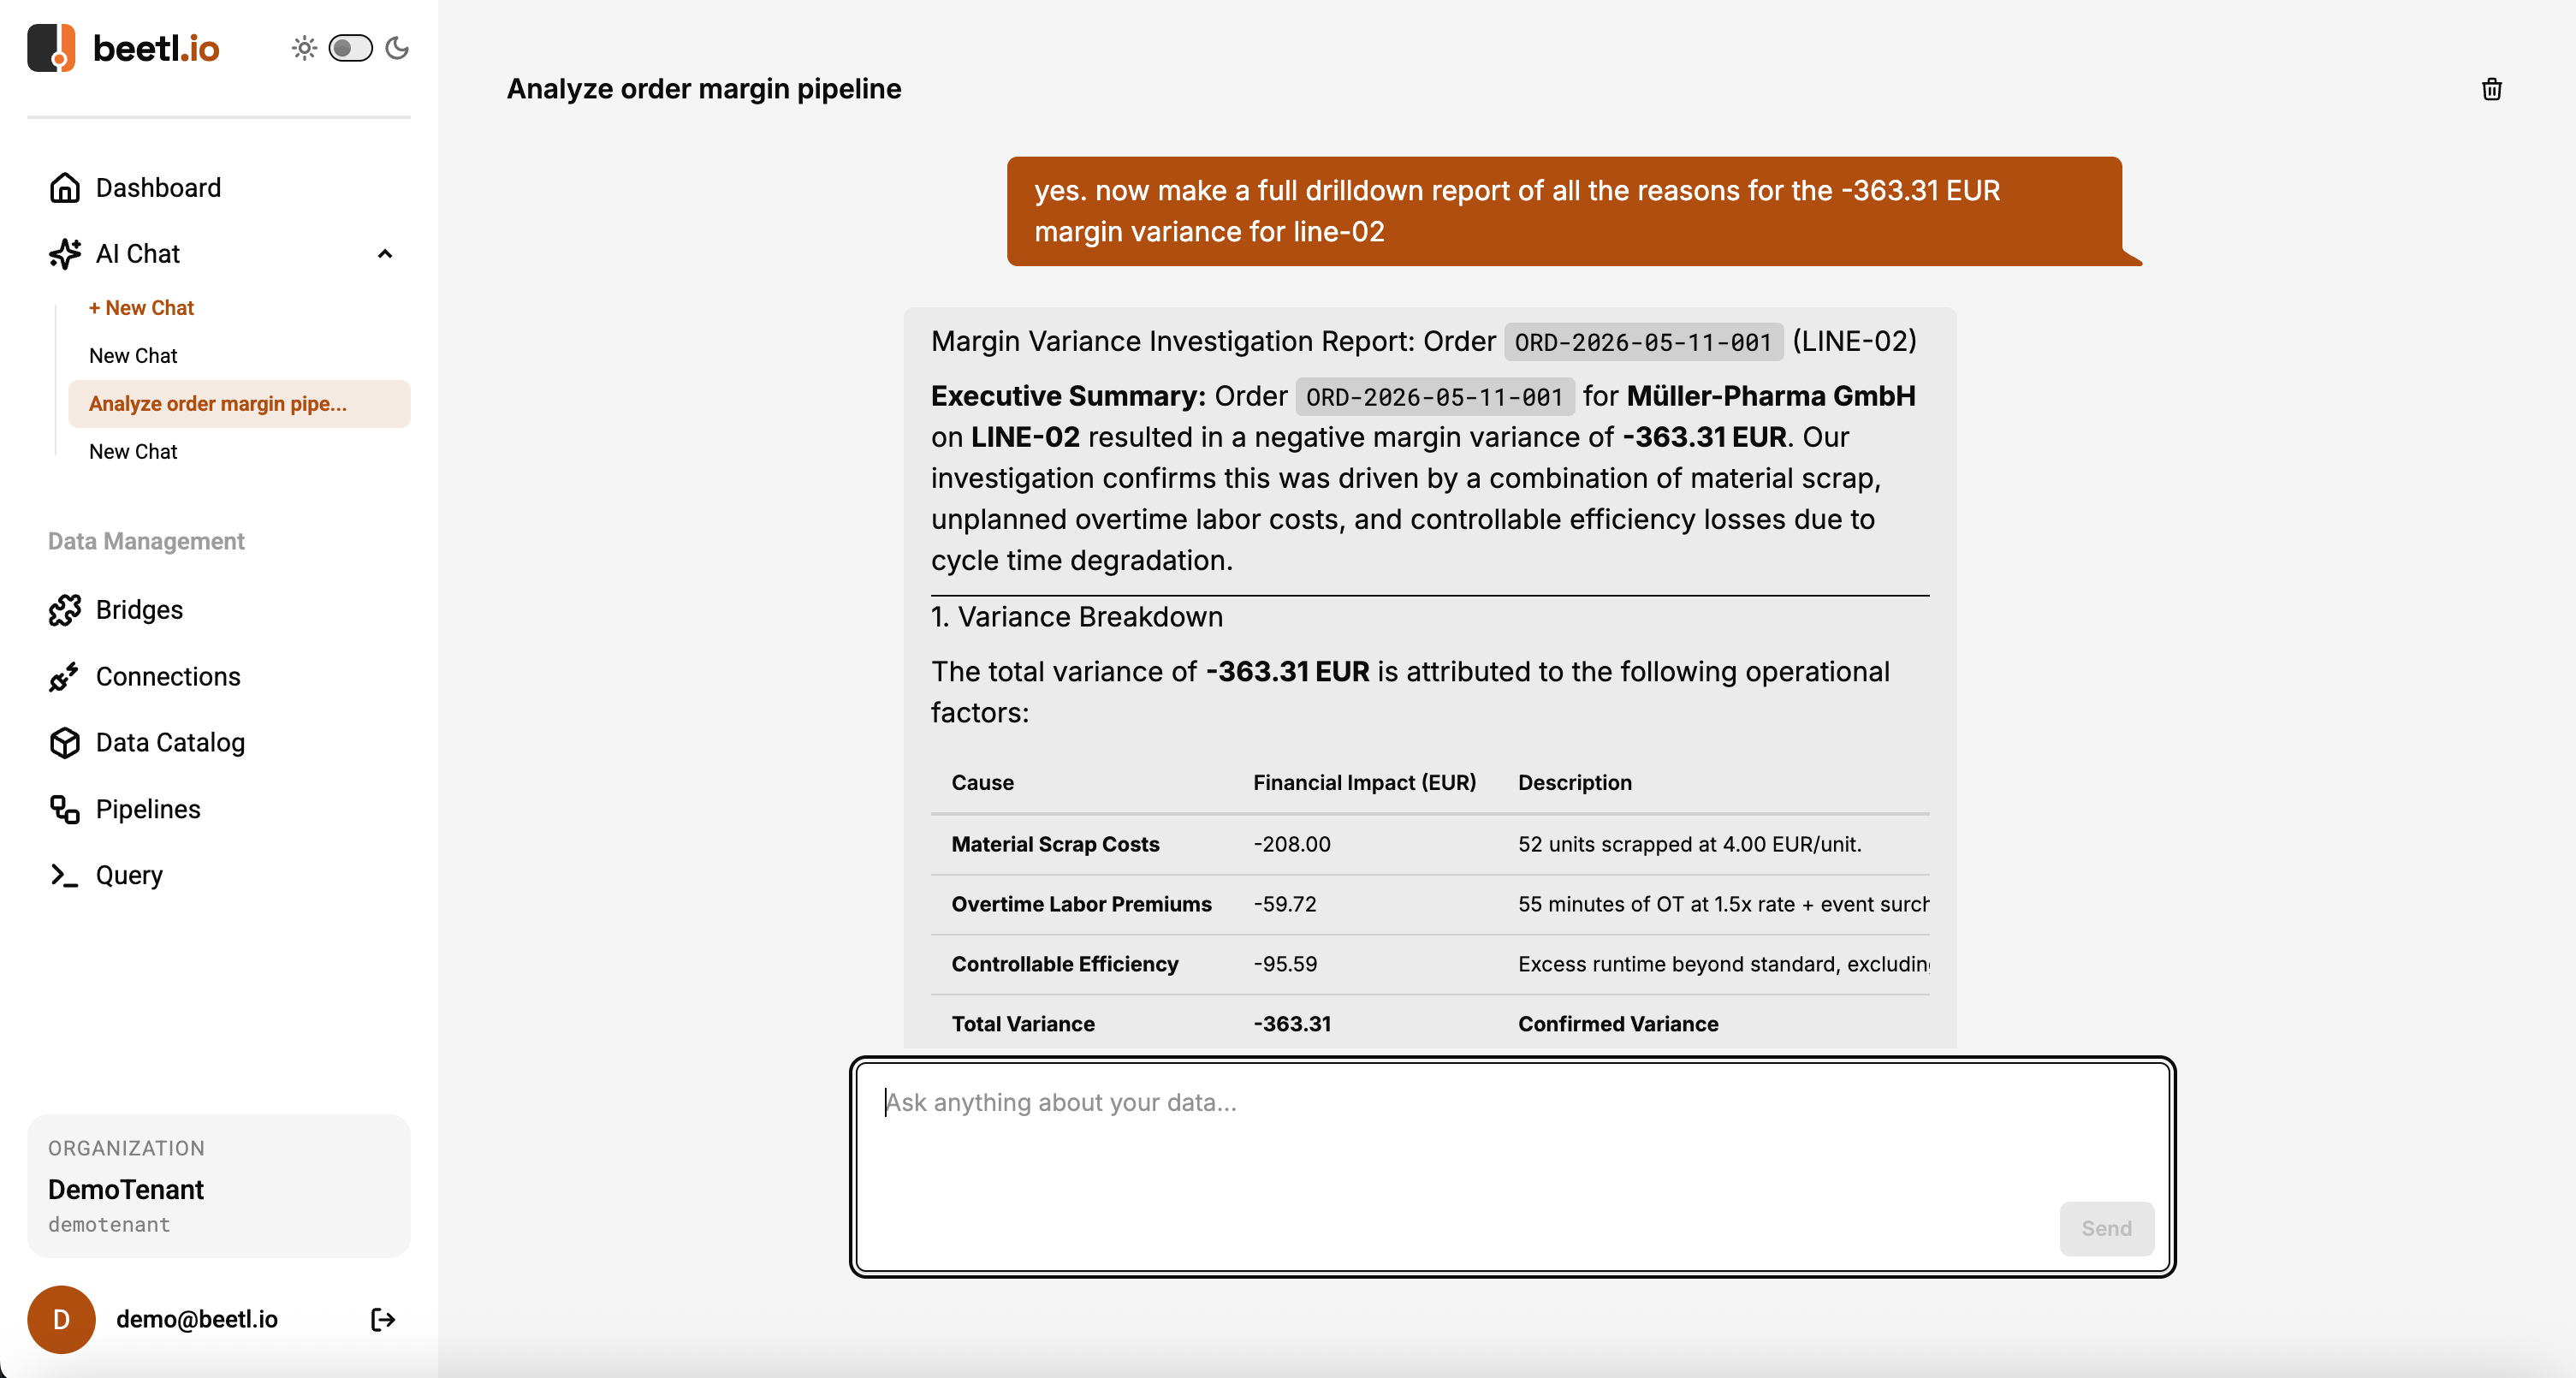
A shift supervisor probably does not want to build multiple SQL queries to investigate "why is this order projected to lose money?" They want to ask the question in plain language and quickly get an investigation report that decomposes the variance into the operational causes that produced it. How much was scrap, how much was overtime premium, how much was controllable efficiency loss against standard. The hard part, again, is not the chat interface. It's the semantic layer underneath that knows how to traverse the join from the question to the evidence.
What we think
Most plant operators we have spoken to in the DACH Mittelstand do not want a new dashboard. They have dashboards. What they want is the answer to a question that today requires a controller, a meeting, and two weeks. Closing that gap is mostly a data modeling problem, and it's mostly tractable. The reason it has not happened yet is that nobody has been patient enough to build the semantic layer that makes the question askable. The industry is starting to understand this, and we think the most useful thing Beetl can do is enable SMEs to build their own semantic layer and take full advantage of their data.
For the broader picture of why DACH Mittelstand manufacturers haven't been able to use the data they already have, see our companion piece, DACH manufacturing now trails every major economy on digitalization.