
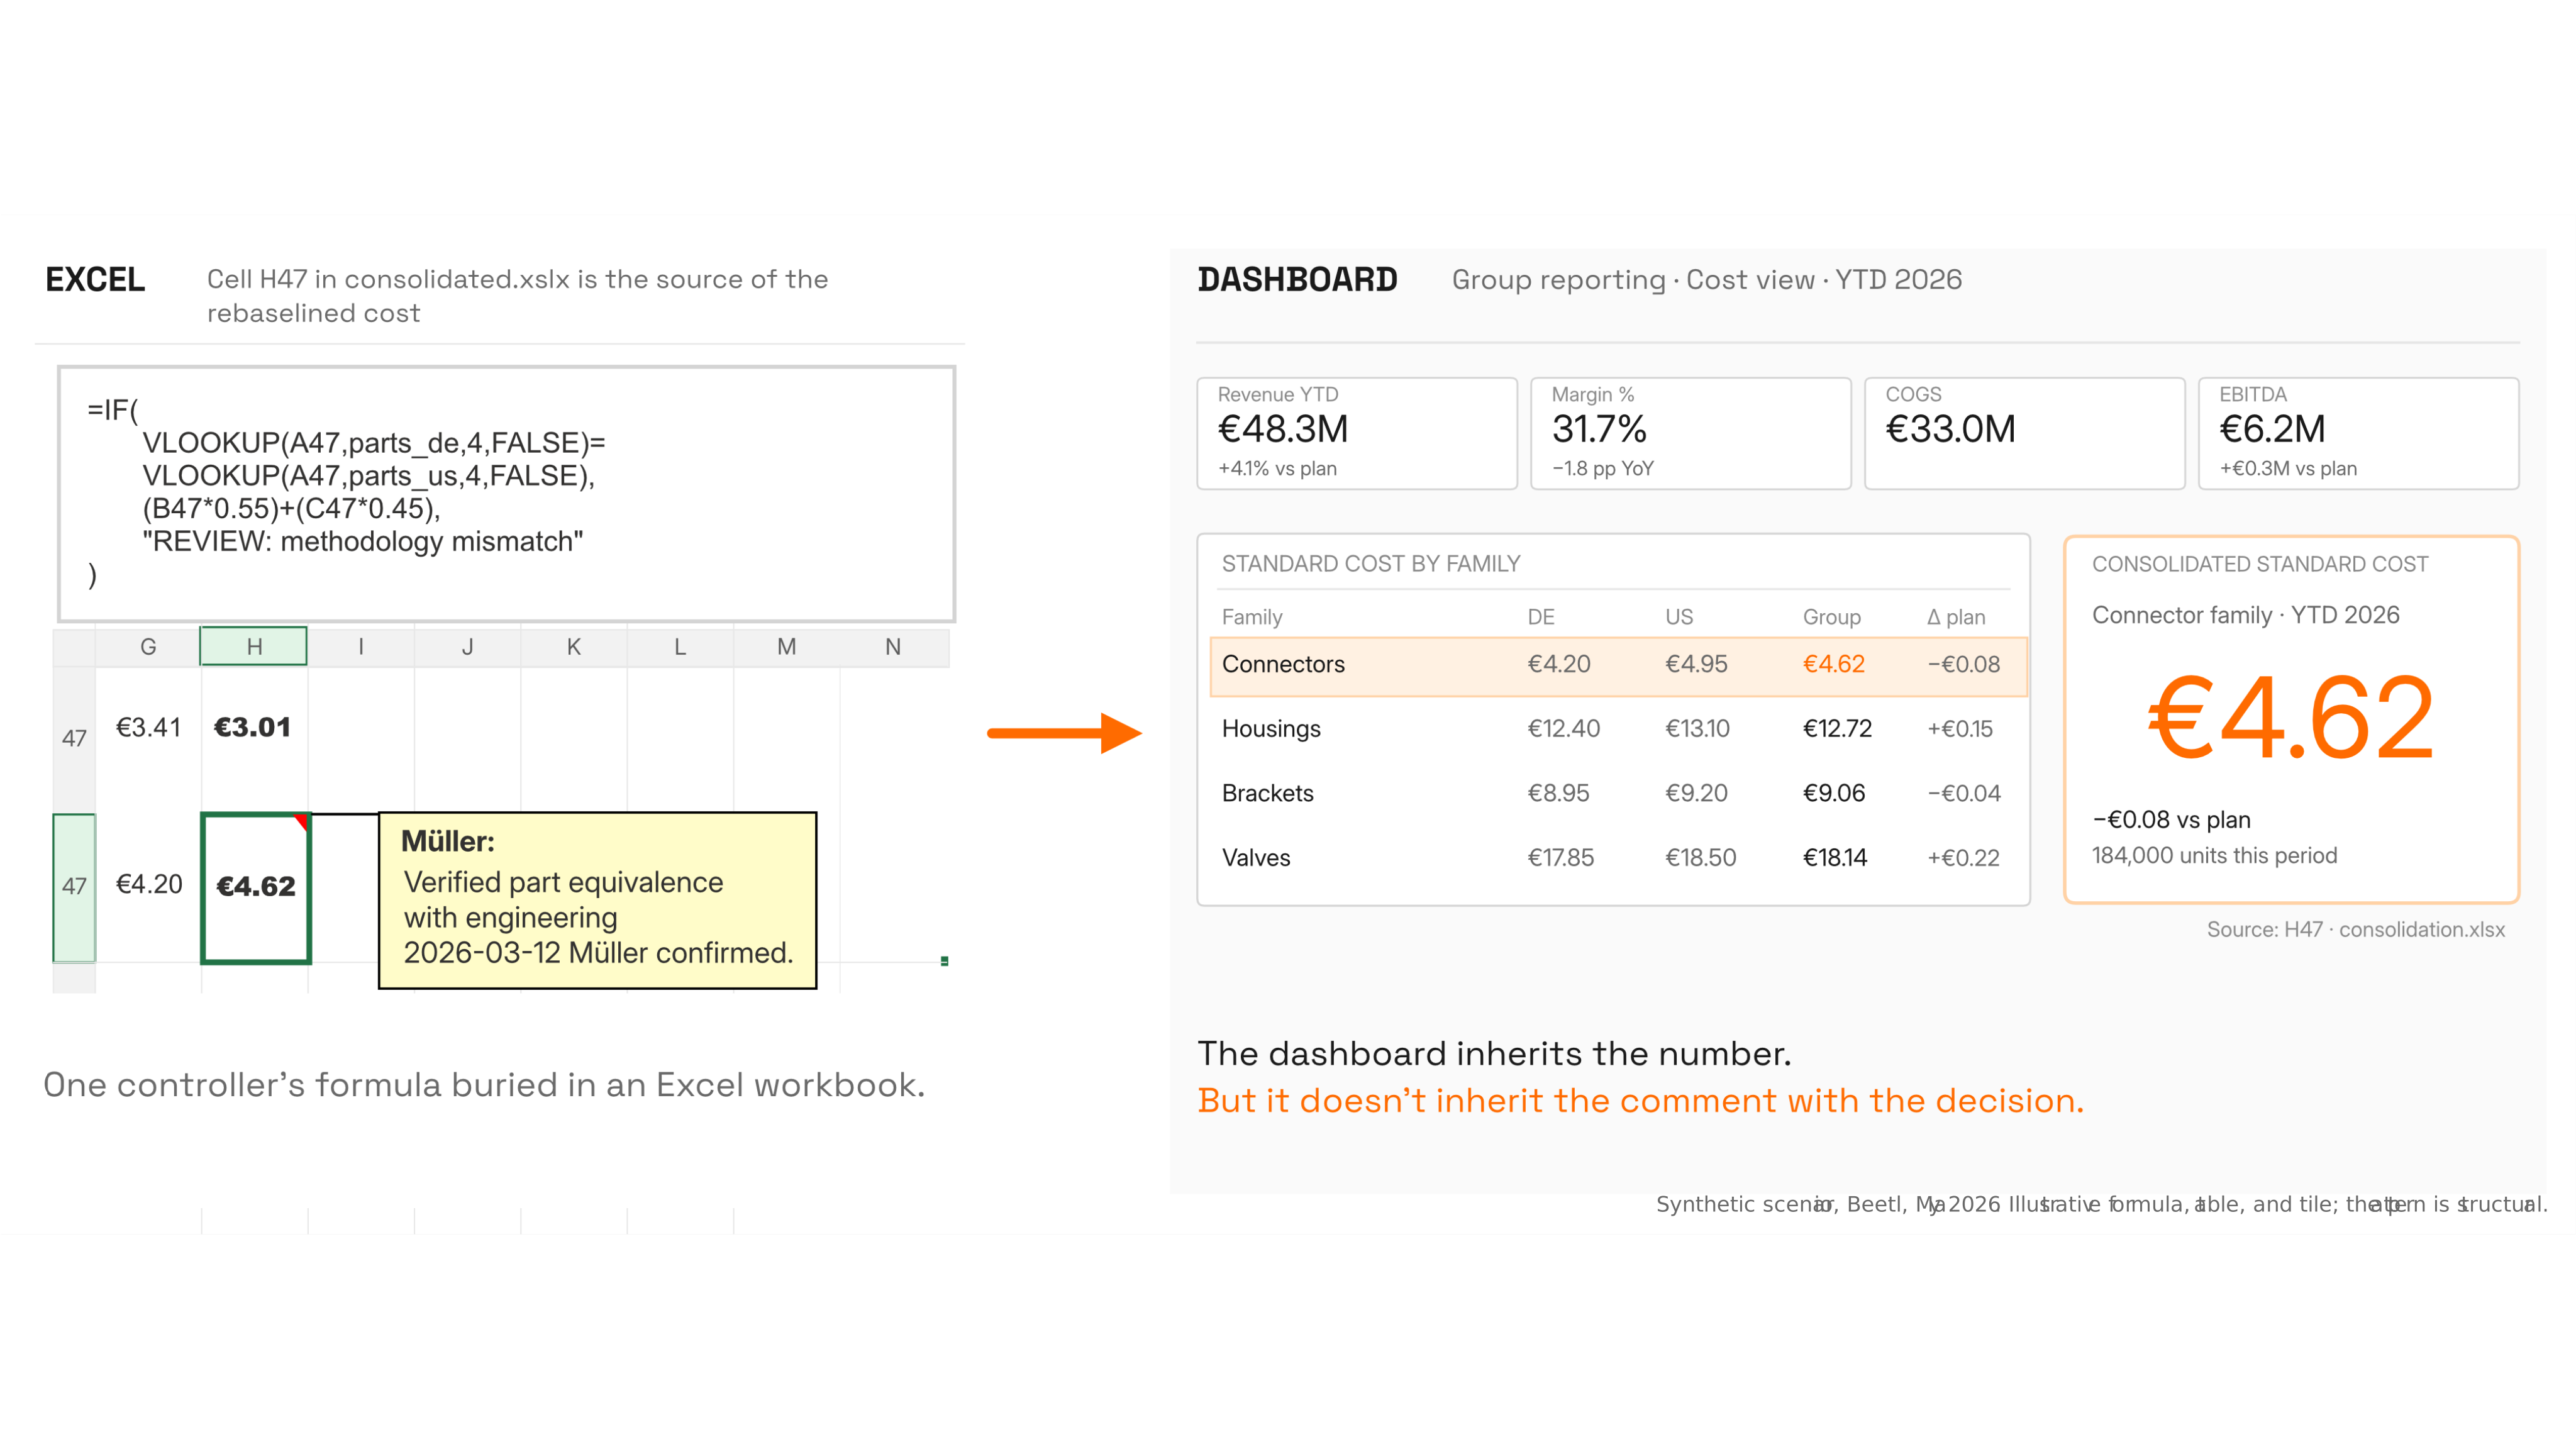
For months or years after a manufacturing acquisition, the Excel workbook is the consolidation engine. The Power BI card shows the resolved number but never the formula or the comment beside it. That is what fails at year-end audit.
Imagine it's Tuesday, 9 months after the deal closed. The acquired German subsidiary ships parts to the US entity at one standard cost; the US entity books the same part-number-equivalent at a different one. The group Power BI report shows a single consolidated figure. The new Private Equity (PE) operating partner sends a message asking how that figure was computed. The controller opens her workbook. The answer is in cell H47, with a comment from March about a phone call with engineering.
What the industry sees
The discourse around post-merger reporting clusters into three vendor categories.
The first is the Excel-from-ERPs category. Spreadsheet Server, Jet Reports, and a long tail of competitors connect Excel to 140 ERP systems and deliver consolidated data into the workbook automatically. This is the category that takes the controller's existing tool seriously.
The second is the Power BI migration category, made urgent by Microsoft's deprecation of the legacy Excel and CSV import experience in Power BI Service. From 31 May 2026, new semantic models can no longer be built from the old import path. From 31 July 2026, existing models stop refreshing. Vendors and Microsoft itself are pushing controllers toward Dataflows, OneLake, and the Fabric stack.
The third is the consolidation platform category. OneStream, Tagetik, BlackLine, and SAP S/4 Group Reporting are credible products with mature audit trails, validation rules, and workflow approvals. Large groups deploy them; mid-market acquirers buy them on the way to scale.
Each of the three is correct as far as it goes. Each assumes the upstream ERPs already agree on what a vendor, an account, or a standard cost means. During the integration window, they don't.
What the controller is actually doing
The controller in the opening scene has seen the workbook fail twice in the last year. Once in August, when she went on leave and her replacement could not produce the monthly consolidated cost report because the inheritance of cell logic across the file's 22 sheets existed only in her head. Once in October, when the auditor asked how the group standard cost for the connector parts family had been computed, and the answer took 3 days to reconstruct from comments, email threads, and a conversation with the engineering lead.
The single decision behind that group standard cost is worth walking through.
The acquired German subsidiary books the connector part costs at €4.20 standard. The US sister entity books the same part-number-equivalent at €4.95 standard. Engineering confirmed in March that the parts are mechanically identical; the cost difference is a methodology choice. The controller decided to report a weighted blend of €4.20 × 0.55 and €4.95 × 0.45, which resolves to €4.62, reflecting the rough share of group production volume that each entity contributes.
That decision lives in cell H47 of the consolidation workbook. The formula is an IF wrapped around two VLOOKUP calls and a weighted blend. A comment above the cell reads: Verified part equivalence with engineering 2026-03-12, Müller confirmed. The Power BI tile labelled Consolidated standard cost €4.62 draws from H47.
The reframe is implicit. The workbook is doing the consolidation. The dashboard is reporting the result.
The gap the BI tooling doesn't close
Microsoft Fabric tracks data lineage in the technical sense. The semantic model behind the Power BI tile knows which dataflow refreshed it; the dataflow knows which file it pulled from; Purview catalogs the assets across the tenant. If the question is which file was the source of the consolidated standard cost figure, Fabric answers it.
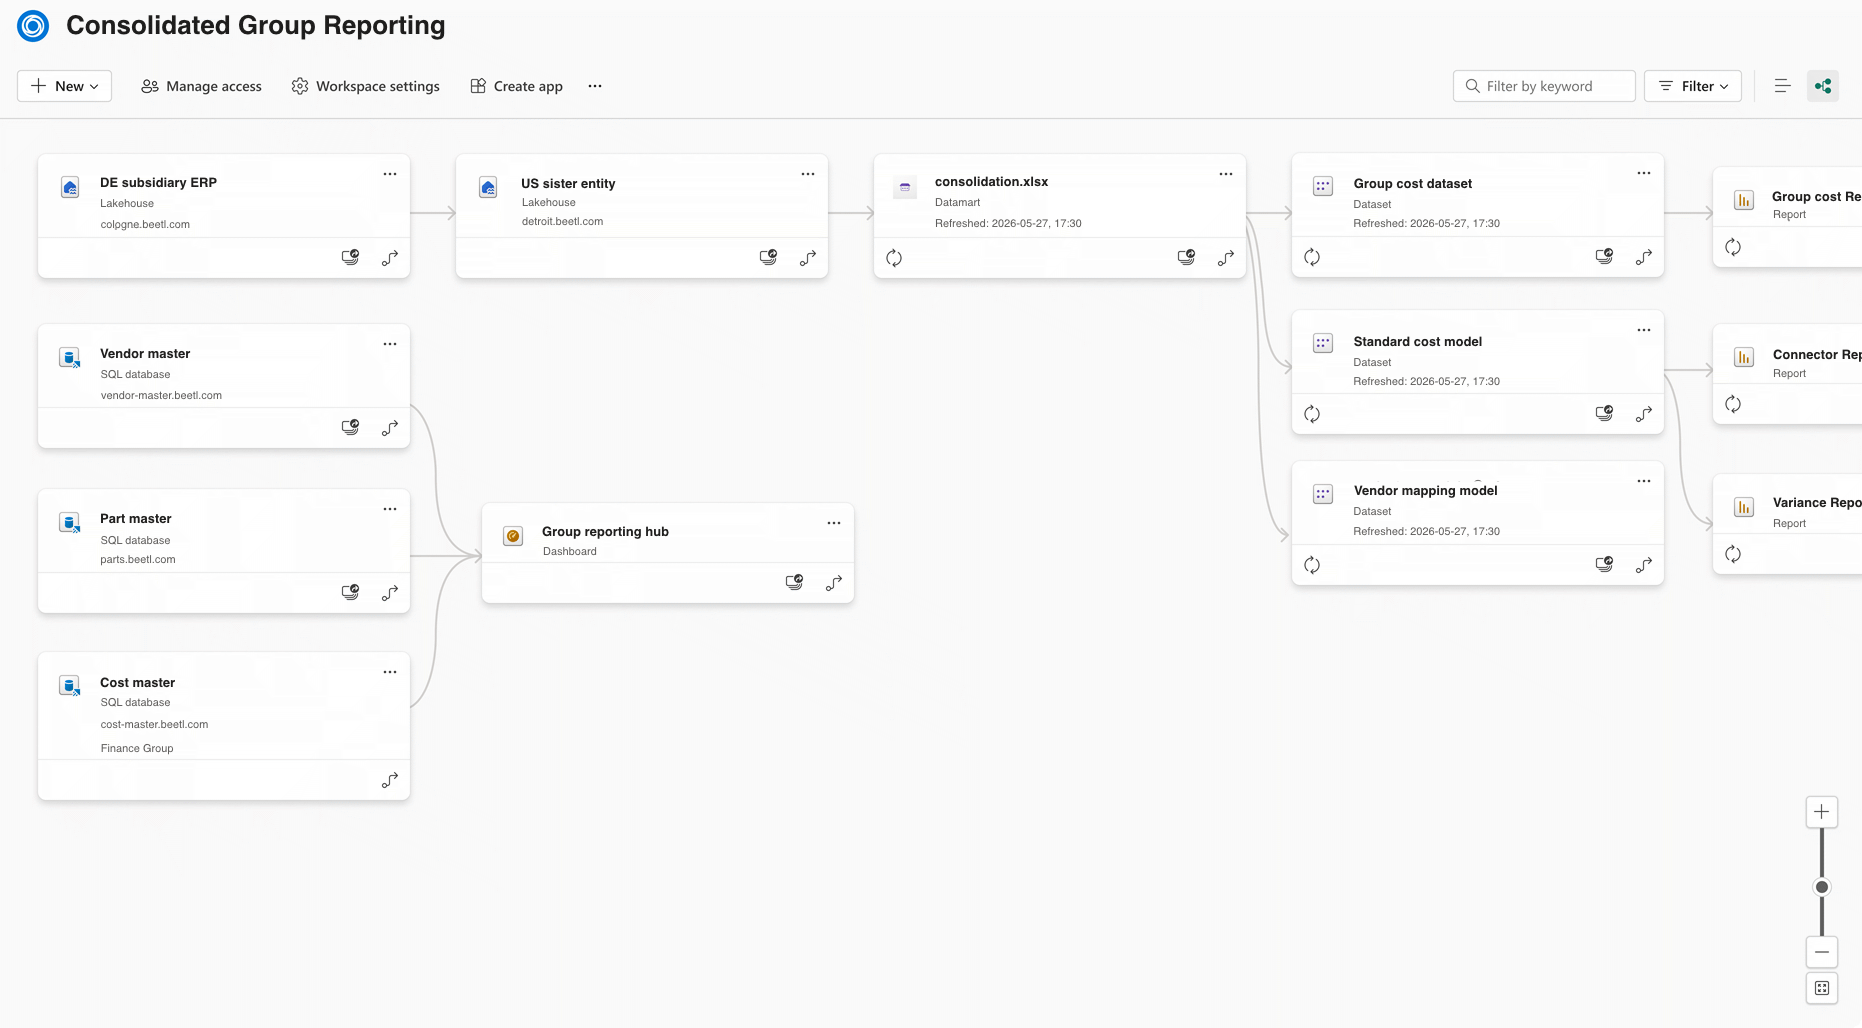
The question Fabric does not answer is the one the PE operating partner actually asked. He wants to know why €4.62 and not €4.57 or €4.78. The answer is in the weighted blend the controller chose. The reason she chose 55/45 and not 50/50 is the rough split of group production volume between the two entities as of Q1. The reason a blend is acceptable at all is the engineering confirmation that the parts are equivalent. None of that lives anywhere a second person can audit.
This is the gap that opens between the workbook and the BI layer. The workbook is where the decisions are made. The BI layer is where the resolved numbers are displayed. The decisions never reach the display, and the display never sees behind itself. When the controller leaves, the audit asks, or the PE quarterly review runs, the loss is asymmetric: the dashboard is still there, the rationale is gone.
What a working version looks like
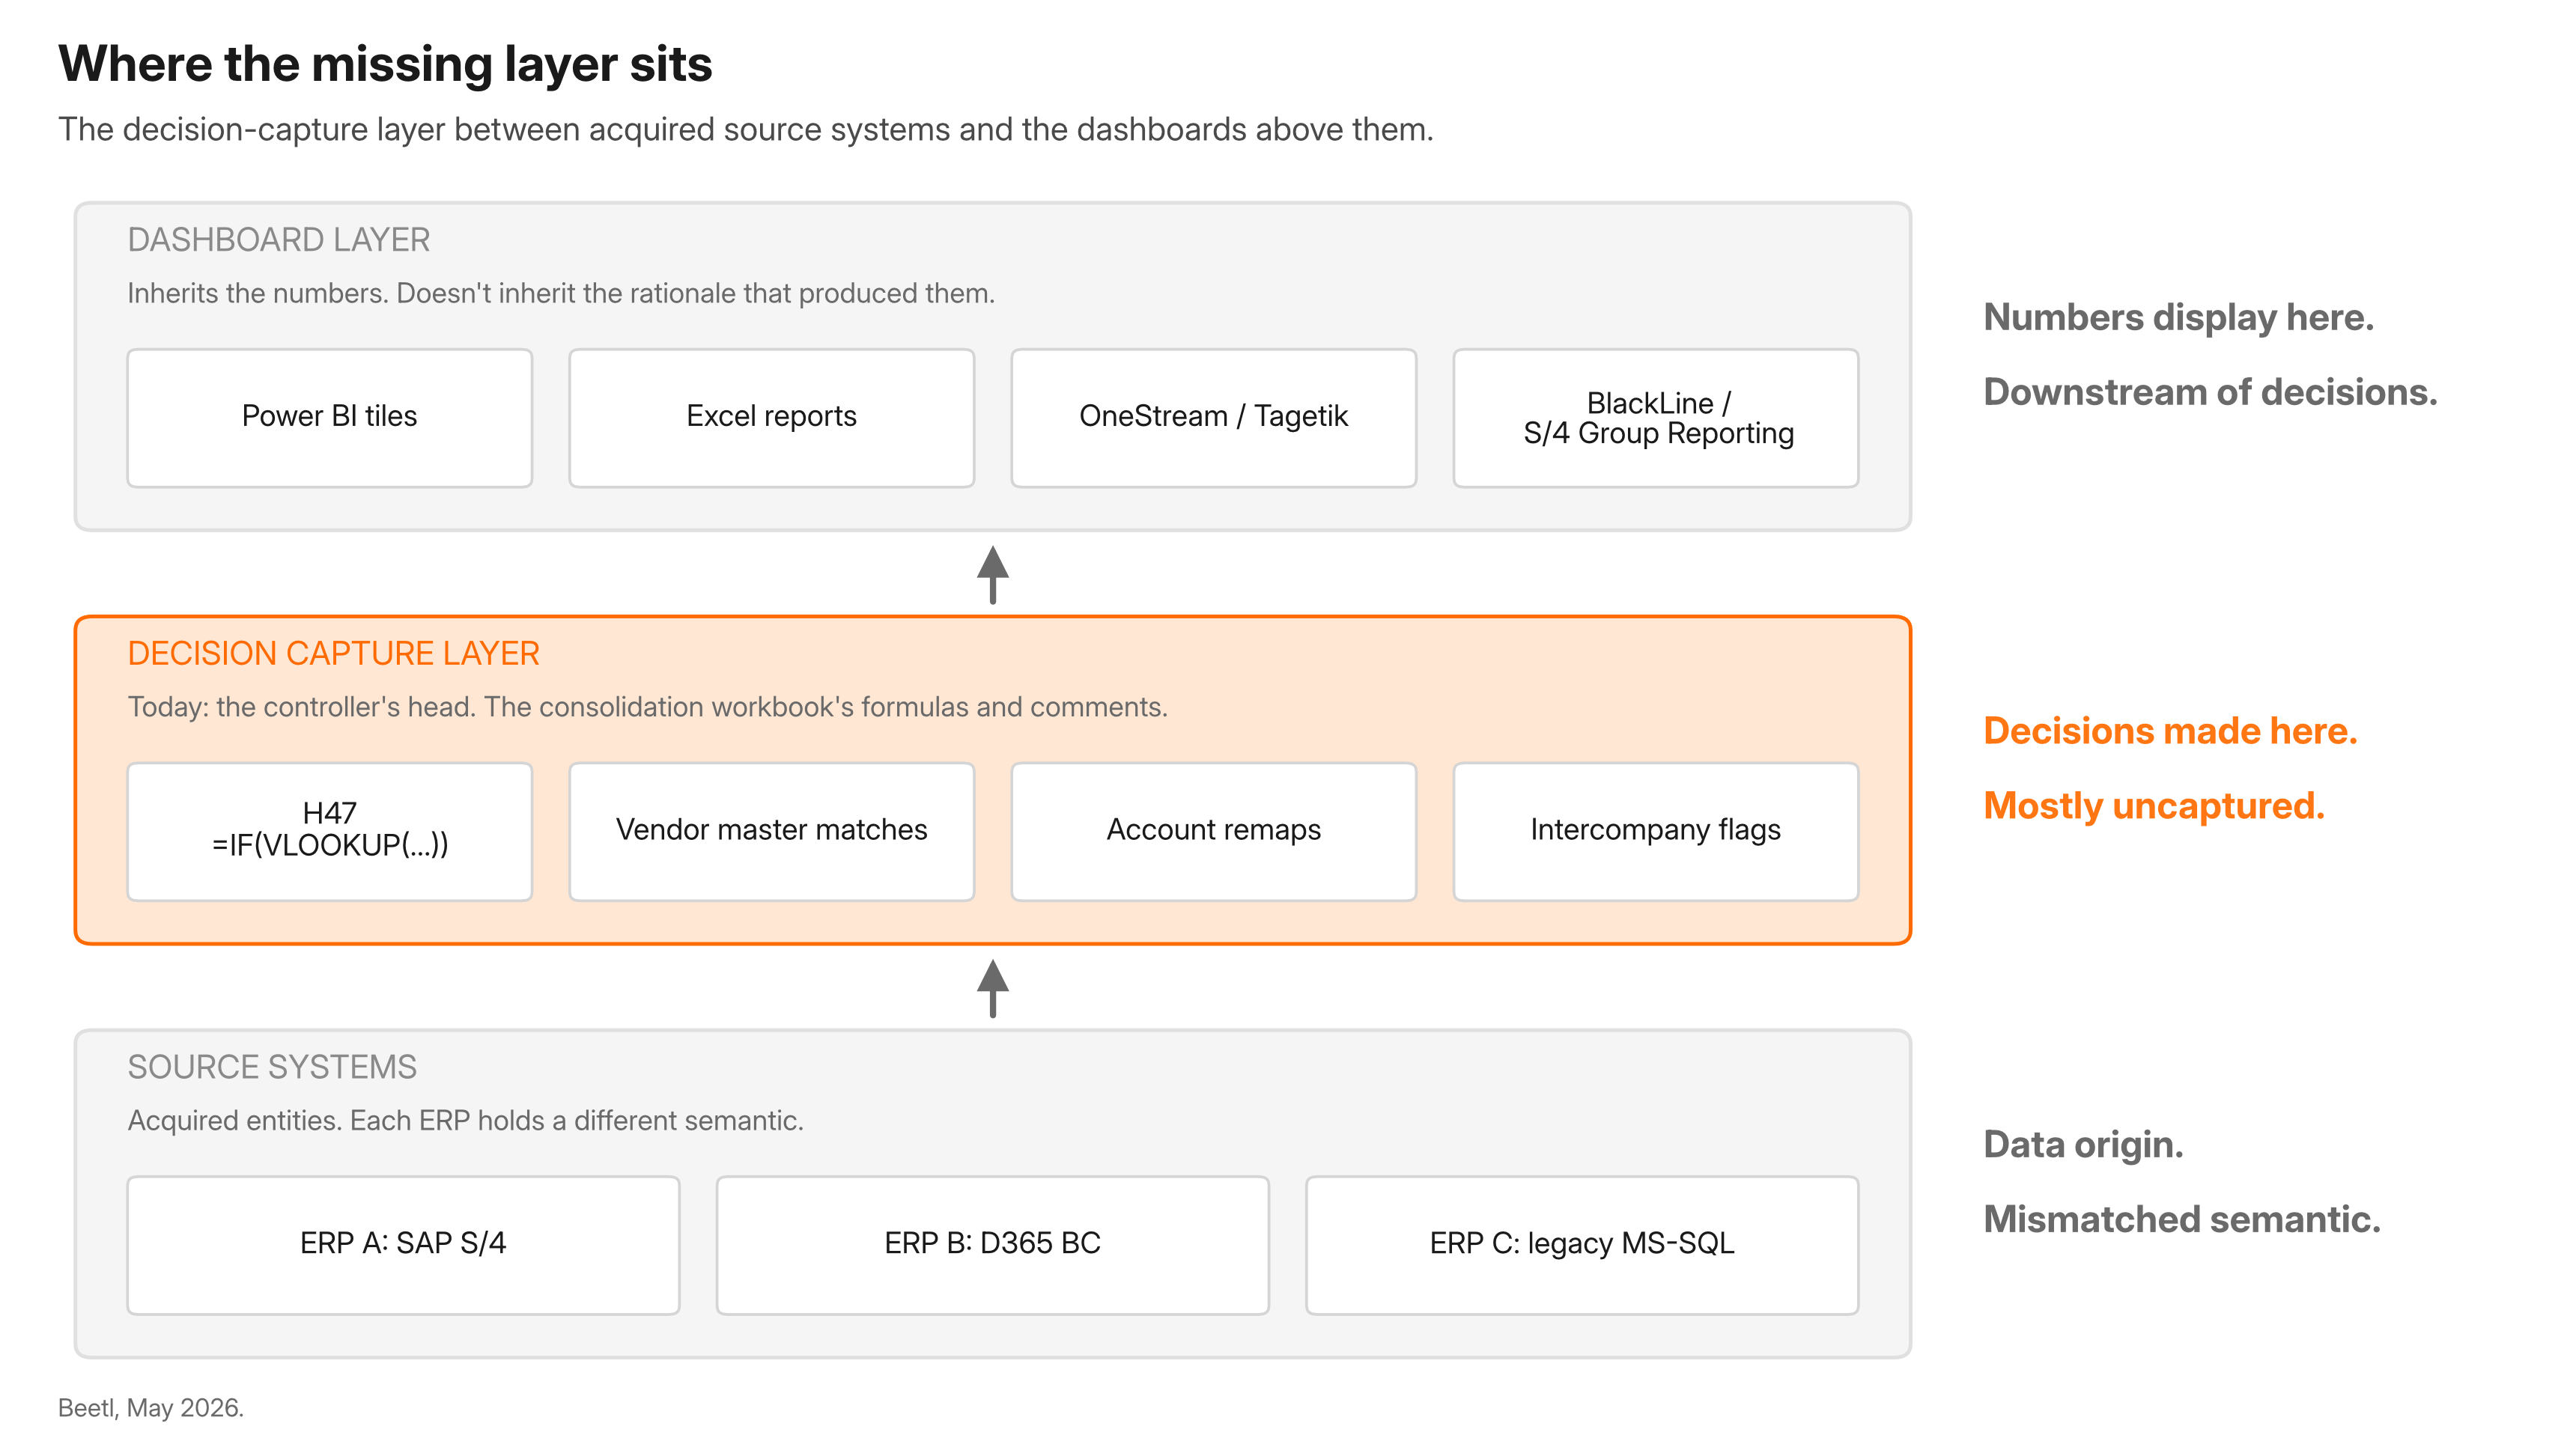
OneStream, Tagetik, BlackLine, and SAP S/4 Group Reporting are downstream tools. They assume the consolidation logic has already been agreed on, the chart of accounts has been mapped, and the entities share a stable common semantic. Once those conditions are met, they are excellent at workflow approvals, validation rules, and audit certification. None of those conditions are met during the integration window.
The missing layer sits one step upstream of where those tools begin. It captures, for each decision the controller makes inside her working surface, the records being matched, the evidence supporting the match, the person who made it, and the date. The working surface stays Excel. The dashboards stay Power BI. The consolidation platform, when the group is large enough to deploy one, stays whatever it is.
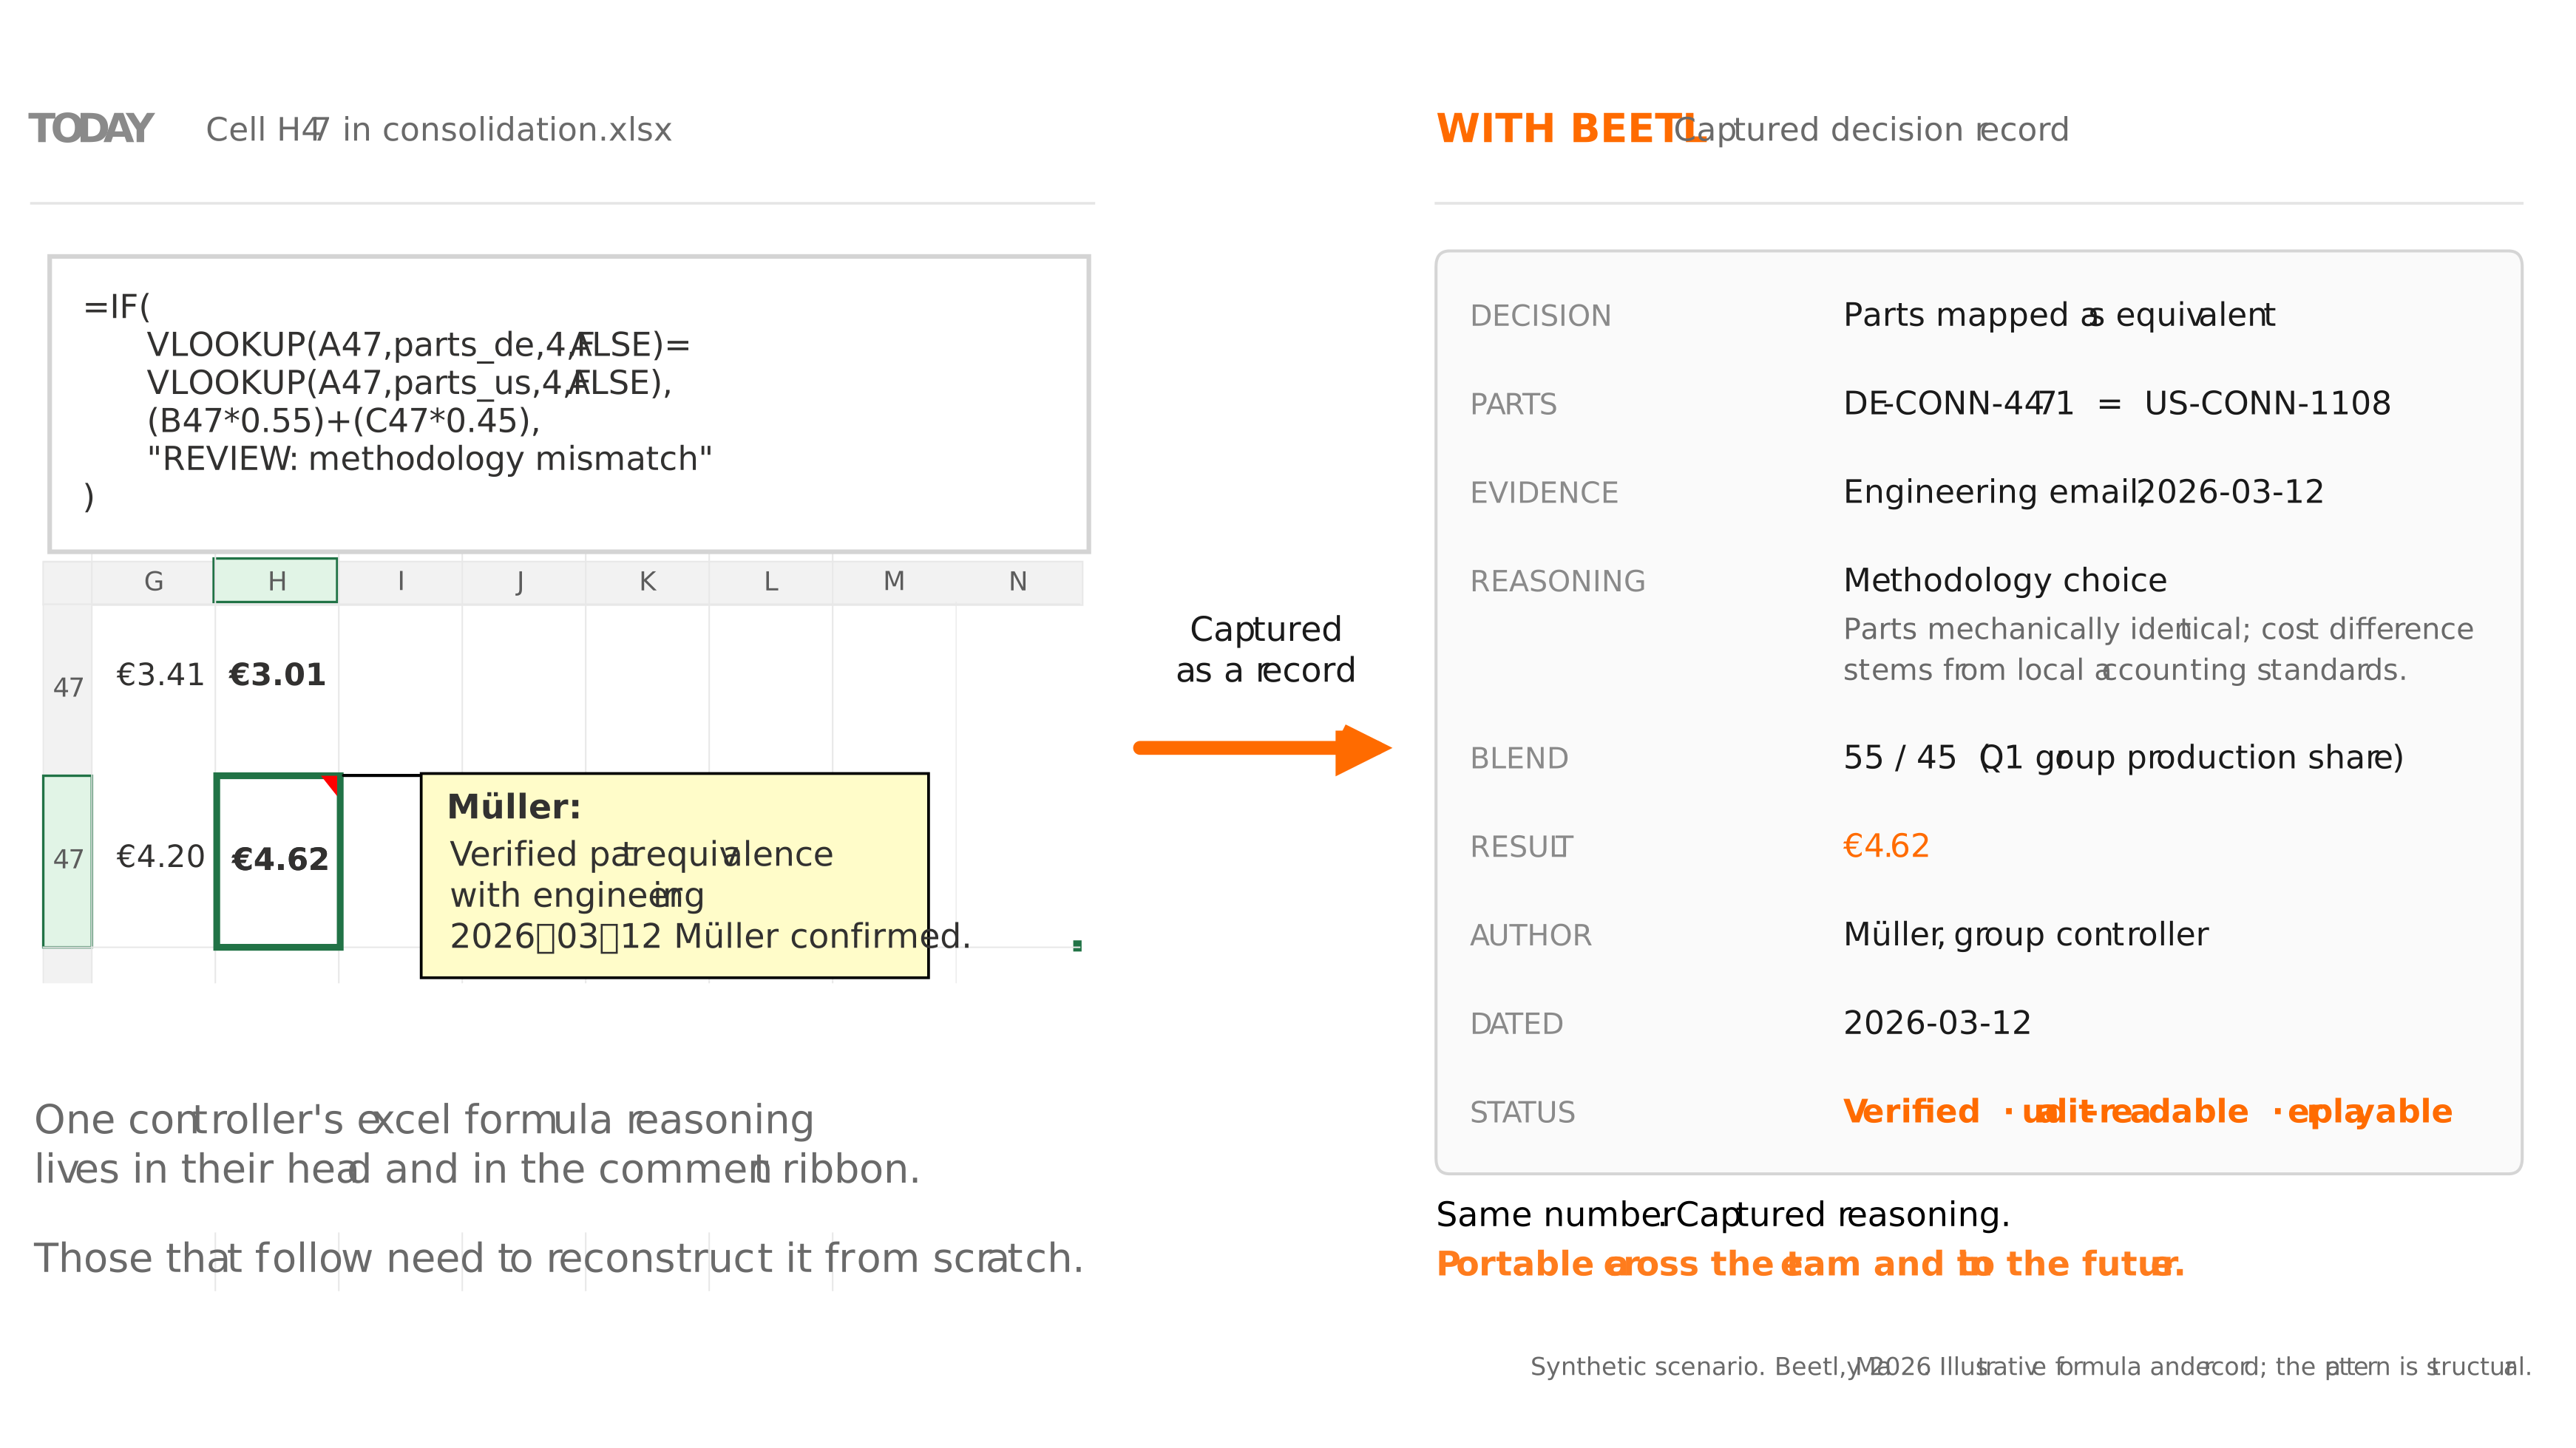
What this captures is the layer of reasoning that currently sits inside formulas and comments. Cell H47's IF/VLOOKUP becomes a decision record: parts DE-CONN-4471 and US-CONN-1108 mapped as equivalent, evidence linked to the engineering email, blend ratio 55/45 chosen on Q1 production volume, controller Müller, dated 2026-03-12. The number is still €4.62. The reasoning is now portable, replayable, and audit-readable.
At Beetl we build and operate the integration layer underneath work like this. The cross-entity reconciliation decisions controllers make inside consolidation workbooks — vendor-master equivalence, standard cost normalization, account remapping, intercompany flagging — become explicit mappings and SQL that can be reviewed and versioned, rather than steps held in a spreadsheet and one person's memory. The dashboards stay whatever they were. What changes is whether the layer beneath them has an owner.
Closing
The Excel-and-Power-BI handoff is not going away. It is doing real work, for real reasons, in the only window during which a single controller can hold the consolidation in her head. The structural problem is what gets captured underneath it.
A starting diagnostic for any post-merger reporting environment: ask the controller for read-access to the consolidation workbook, then count the unique external-workbook references in the formulas. That number is the integration debt the deal model did not price.