
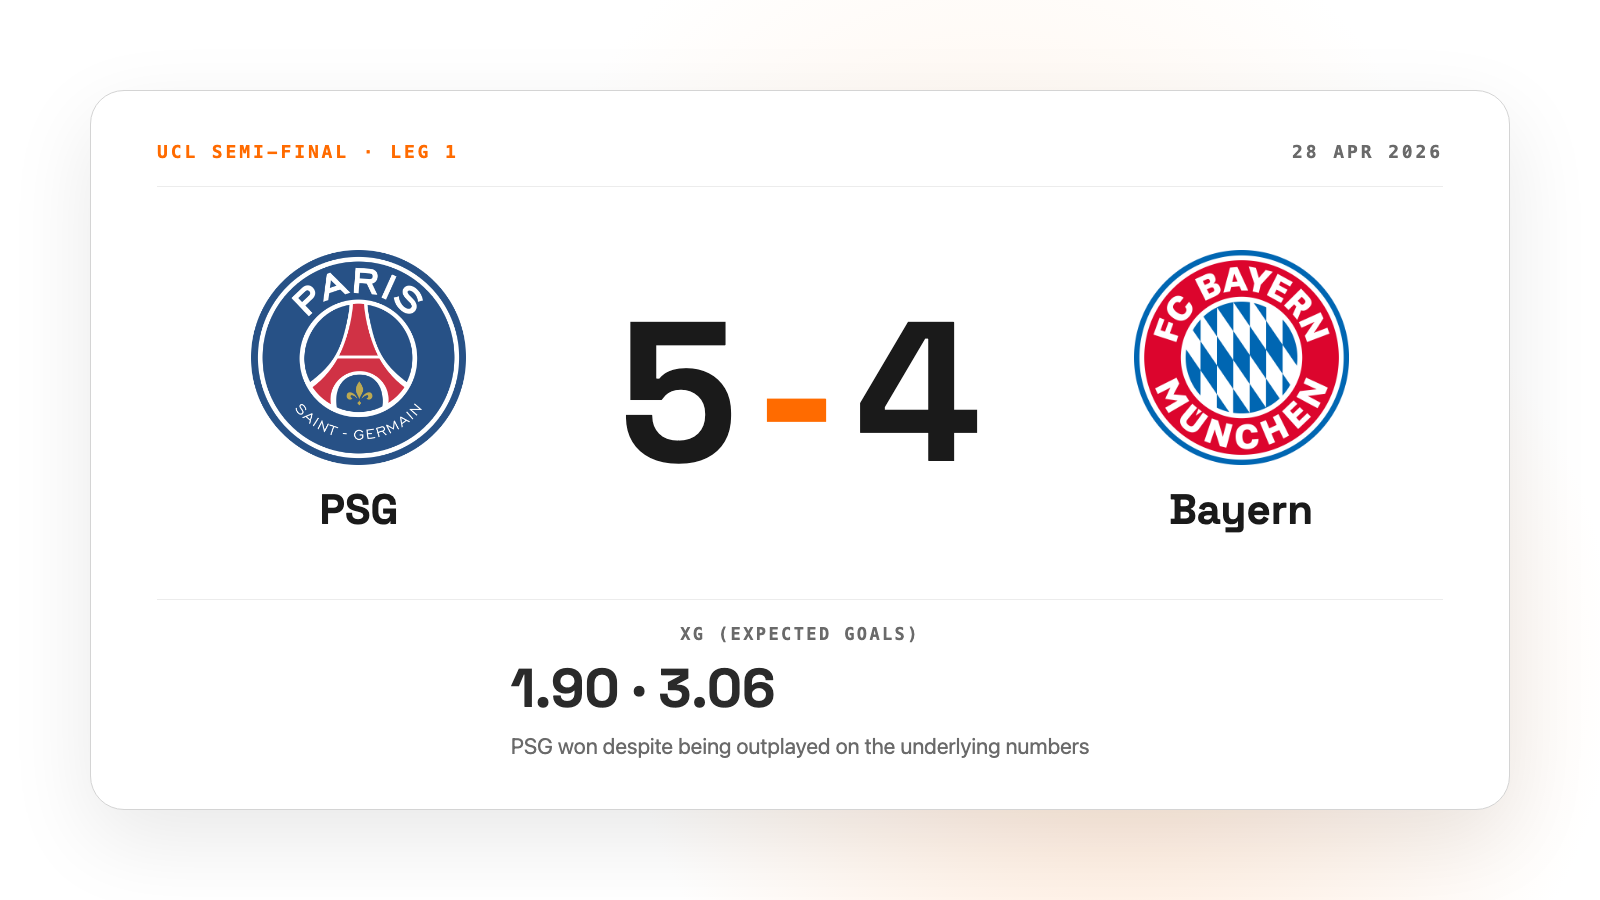
Champions League knockout games aren't usually 5-4 thrillers. April's PSG vs Bayern semi-final first leg was. Bayern had 57% possession, an xG of 3.06 to PSG's 1.90, and six big chances to PSG's two. PSG won anyway. I dug into the data to see what might be going on.
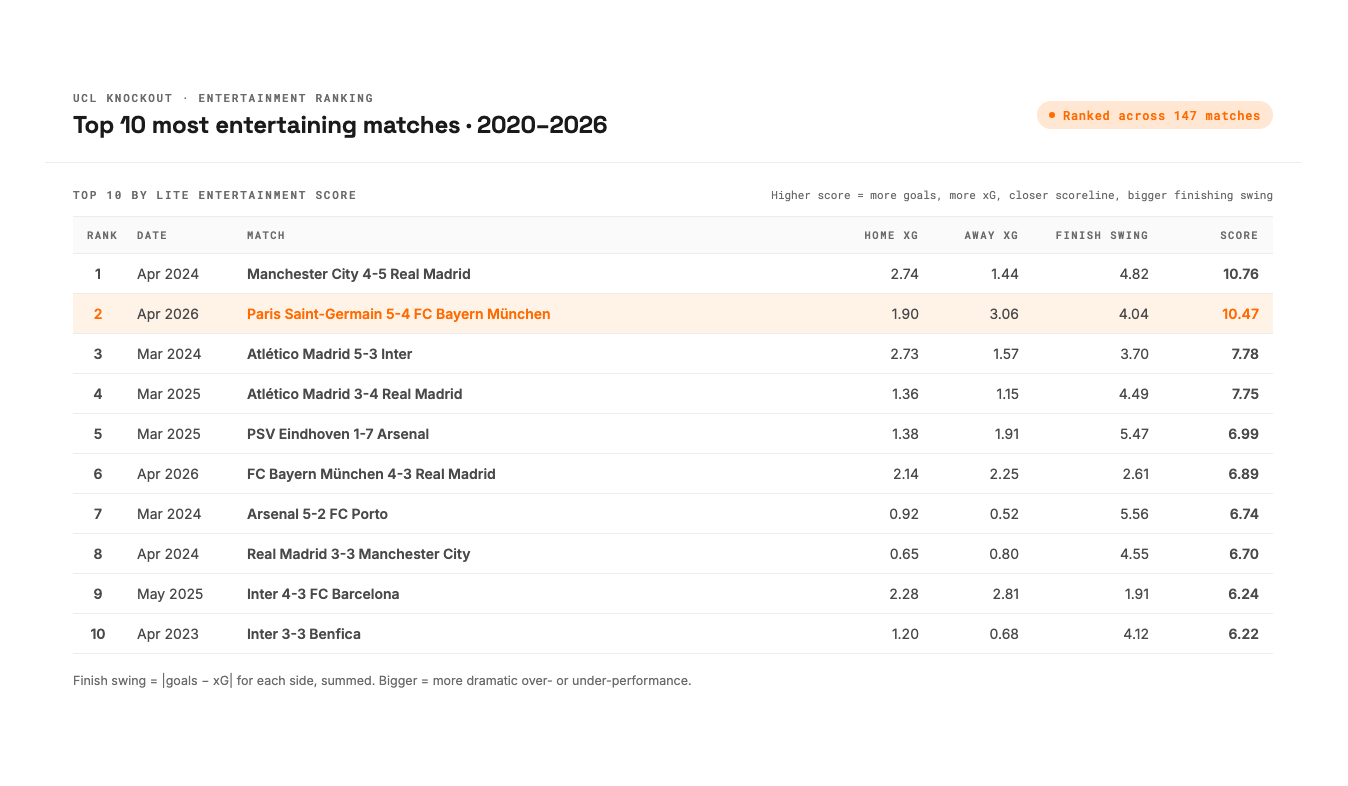
Even the data agrees that the game was the second most exciting Champions League knockout match across the past six seasons. When I scored all 147 UCL knockout matches since 2020 in the dataset by total goals, total xG, and how close the scoreline stayed, only the Manchester City 4-5 Real Madrid match in April 2024 ranked higher.
Going into the second leg, my question wasn't really how good PSG were. It was whether the first-leg result was repeatable, or whether Bayern would simply convert their chances next time. Was something structural giving PSG an edge, or was the 5-4 high-variance just noise that wouldn't survive a second round of 90 minutes? To answer that I needed to look at where PSG's attack actually came from, who was carrying it, and whether any of it was reproducible.
What it took to answer those questions surprised me more than the answers themselves.
Round one: what the first pass of numbers said
My first analysis went up on LinkedIn the day before the second leg. Five things stood out:
PSG over-performs xG by +0.59 goals per knockout match. Across the 16 matches in the sample at that point, they were scoring more than the underlying numbers said they should, consistently, for over a year.
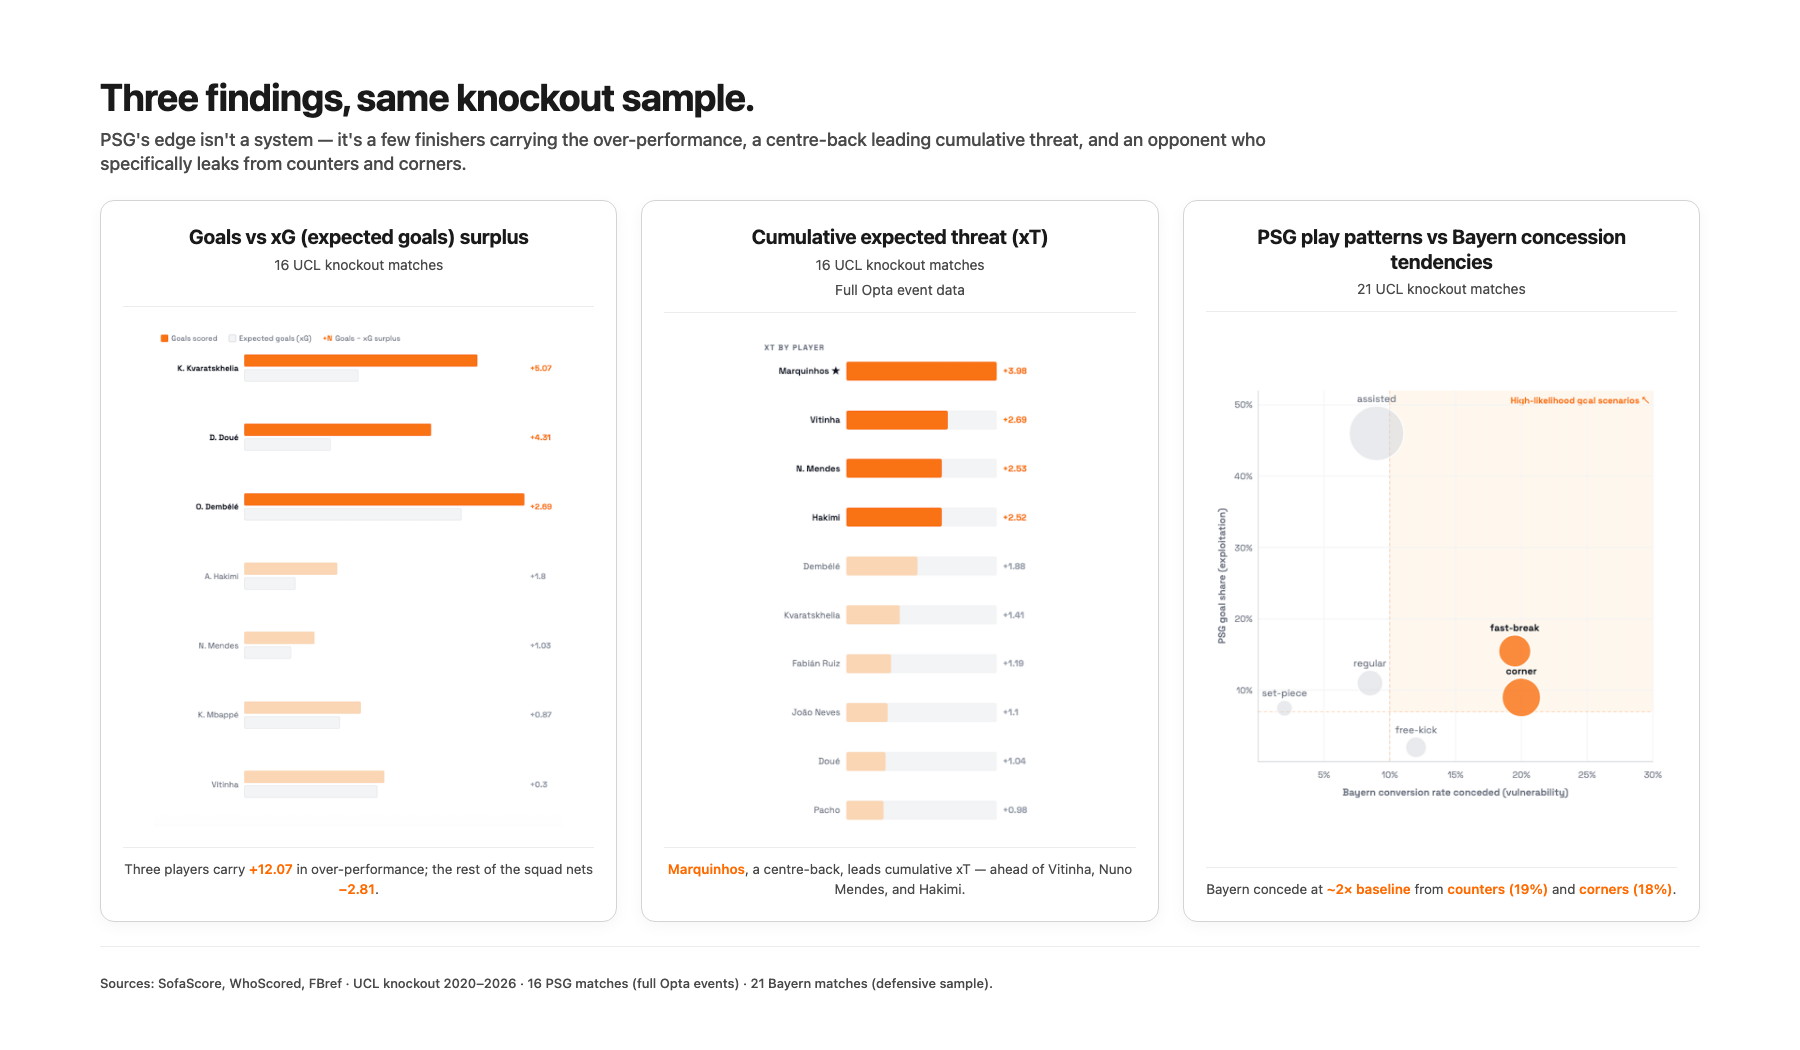
Three players carry 75% of the over-performance. Kvaratskhelia +5.07, Doué +4.31, Dembélé +2.69, for a combined +12.07 across the knockout sample. The rest of the squad collectively under-performs by −2.81. The "we beat better teams on xG" pattern was really "two or three of our finishers are on fire."
Marquinhos is PSG's highest cumulative xT contributor. Ahead of Vitinha, Nuno Mendes, Hakimi, and the wingers. A centre-back leading the threat-creation chart was the kind of finding that sticks out, and a friend's pushback later in the analysis would make me take it apart properly.
Pressing varies by matchup. PSG's PPDA (Passes per Defensive Action, a measure of how high and intense the press is) against Monaco was 5.3, an intense press with the ball recovered high. Against Bayern in the first leg it was 17.1, the deepest sit-back in the entire 16-match sample. Enrique seems to choose the press level by opponent.
Bayern leak from counters and corners specifically. Their defensive profile across 21 UCL knockout matches looked roughly league-average overall, but they concede at twice the baseline rate from counter-attacks (19% conversion against them) and corners (18%). The vulnerability was concentrated rather than general.
The leg-2 prediction I posted was that PSG's most likely goal pattern would be open-play volume from Kvaratskhelia or Doué, or a counter exploiting Bayern's set-piece weakness.
In the second leg, Bayern drew 1-1 at home, outperformed PSG's xG once more (1.41 to 1.06), and went out 6-5 on aggregate. Across both legs combined, Bayern outplayed PSG on the underlying numbers and lost the tie anyway, which was the same pattern PSG had been pulling off all season.
If the analysis had stopped there I would have called it a good outcome. Then a good friend Benjamin Turk read the LinkedIn post and pushed back on the most surprising claim.
My friend was right to push back, the answer was more nuanced
His objection, paraphrased was: "Marquinhos has two goals and zero assists this campaign. He doesn't show up like a creator on the pitch, so how is he number one in expected threat?"
My first instinct was to defend the metric, which is exactly the wrong move. When a number conflicts with what someone watching closely sees, the number is what needs explaining. So I went back to the data and asked three different questions of it.
Round 1: Where on the pitch is the xT coming from?
I split Marquinhos's xT contribution by the zone where each action started:
- Defensive third (start_x under 35 metres): 3.2%
- Middle third (35 to 70 metres): 18.8%
- Attacking third (over 70 metres): 78.0%
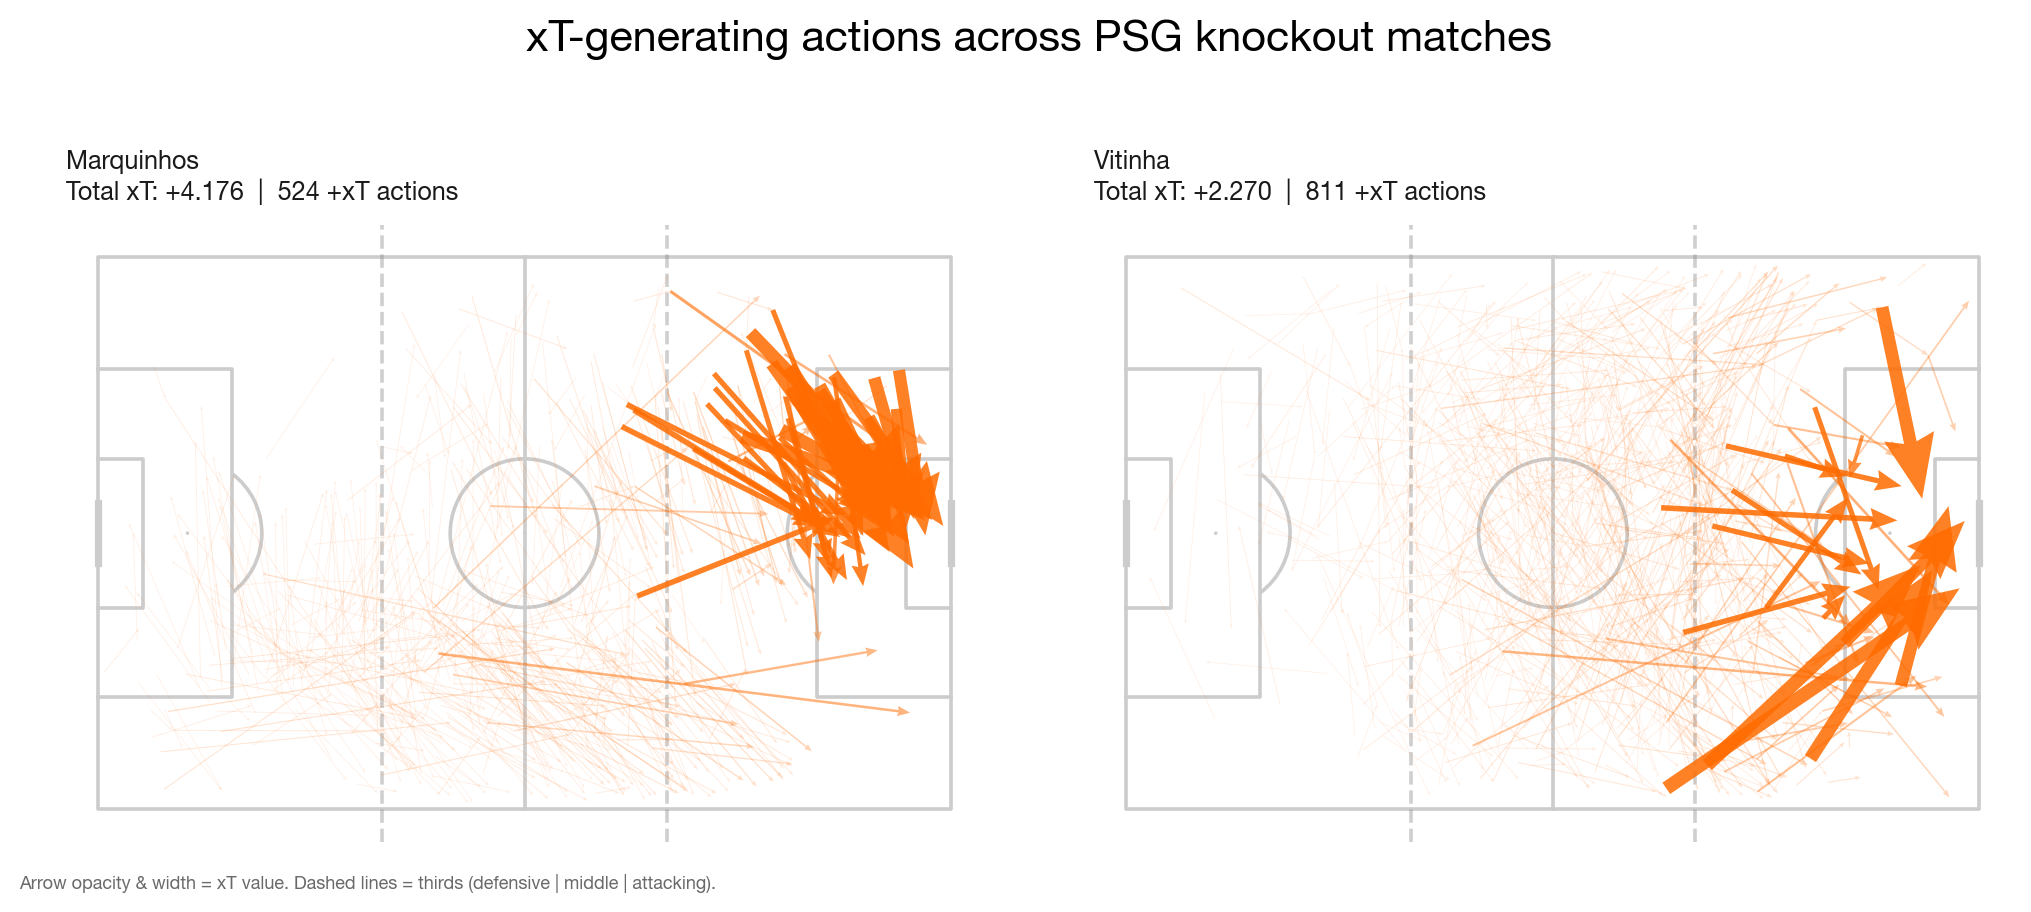
Whatever Marquinhos was doing, it wasn't line-breaking passes from deep. The heatmap of his xT origins clustered tight on the right side of the box edge, well into the opposition half.
The friend's mechanism was wrong, but his instinct that something was off was right, just in the opposite direction.
Round 2: Which matches drove this?
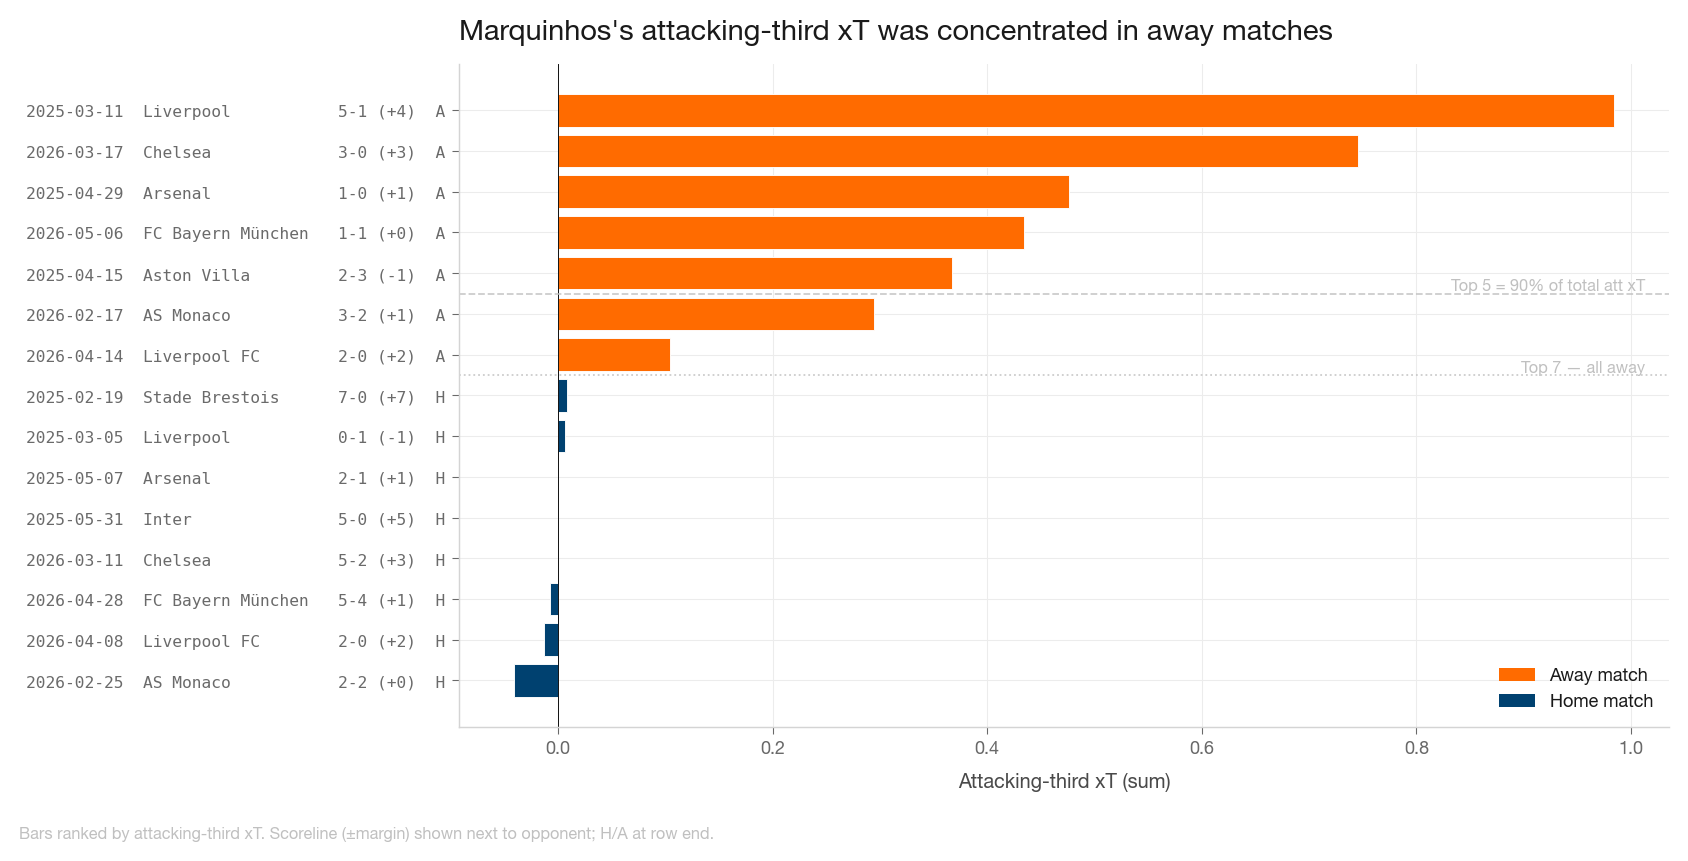
Splitting Marquinhos's attacking-third xT match by match showed an extreme concentration:
- Top 5 matches carried 92% of the total
- Bottom 10 matches showed essentially zero attacking-third contribution
- Top 7 matches by attacking-third xT were all away games
Margin of victory had no meaningful correlation with the metric, but venue did. In away matches where PSG dominated possession, one centre-back stepped up to the right half-space and recycled the ball at the box edge. Through many short passes inside high-value zones, xT accumulated a little bit at a time. Not a creator role; a positional artifact of how PSG were playing those specific matches.
Round 3: What if I change the metric?
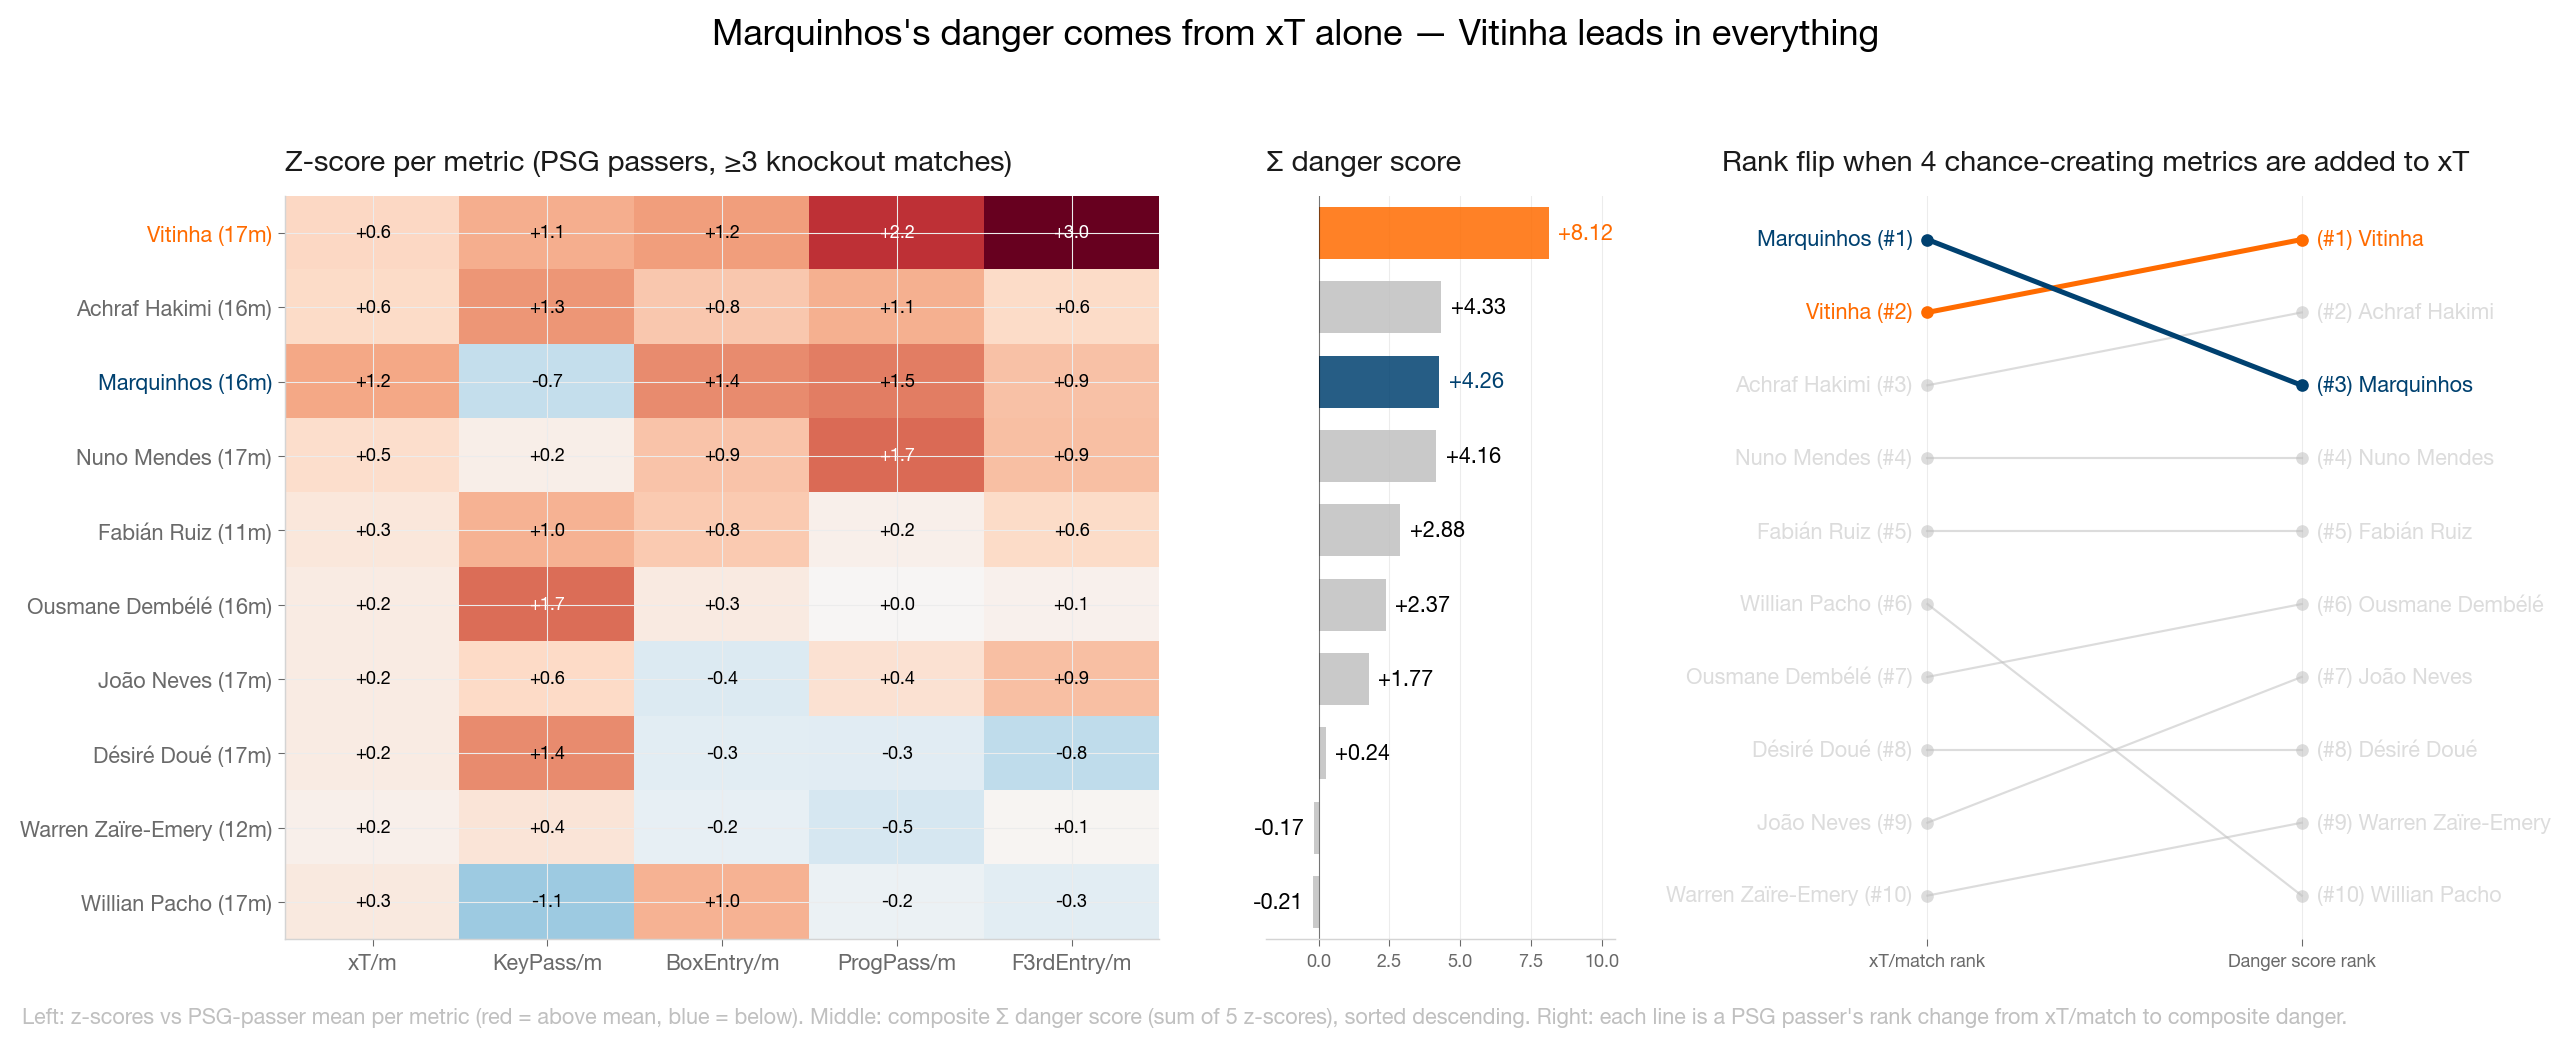
xT measures whether an action moves the ball into a more dangerous zone, but it doesn't require the action to lead to a chance, a shot, or a goal. So I added four measures that do:
- KeyPasses: passes leading directly to a shot
- BoxEntries: passes ending in the penalty area from outside it
- ProgressivePasses: forward passes of 10 metres or more
- FinalThirdEntries: passes from the middle third to the attacking third
I z-scored each metric across players with three or more matches and summed them into one composite "danger" score. The ranking flipped: Vitinha +8.03, Hakimi +4.30 (next PSG player), Marquinhos tied for third.
Raw KeyPass counts across 17 matches told the same story: Marquinhos 5, Vitinha 27, Hakimi 28, Dembélé 32.
By creation metrics, Marquinhos sits at the bottom of the rotation. By aggregate xT, he led the team. Both numbers are real, and they describe the same player doing different things.
The three rounds were inconsistent enough that the original "Marquinhos is number one" framing depended entirely on which metric I had picked.
Pick a different one and the answer flips, which is the actual story.
What I actually learned about the matchup
Bayern outplayed PSG twice on the underlying numbers. xG, xT, dangerous-player counts, dribble volume all favored them across the tied game. PSG's edge isn't tactical superiority; it's finishing concentration in two or three players, plus a defensive structure good enough to absorb an opponent who is creating more.
Vitinha, not Marquinhos, is the actual engine. He leads PSG in keypasses, progressive passes, and final-third entries across 17 knockout matches. Under any composite that includes chance creation metrics, Vitinha was the answer all along.
So is the first-leg result repeatable? Probably not as it landed. The 5-4 was high-variance finishing on top of a structural disadvantage, and the 1-1 second leg was closer to what the underlying numbers suggested. PSG's edge isn't reliably reproducible; it's a thing that happens to keep working as long as their three finishers stay hot on top of their game.
What it actually took to answer those questions
The most useful answers came from the second, third, and fourth question. The first was the easy part. The reason all three follow-ups happened in a single evening, rather than three more weekends of plumbing, is that the plumbing was already done.
Anything beyond surface-level needed three different sources combined, each strong alone and not enough without the other two:
- SofaScore for shots and xG across 147 knockout matches over six seasons — the comparison sample.
- WhoScored for action-by-action event streams across the 17 PSG knockout matches. Every pass, dribble, tackle with coordinates and qualifiers (KeyPass, ShotAssist, Longball). Raw events have 30+ columns; SPADL (the standardized action format) condenses to about 15.
- FBref for season-level player stats. Context that the per-match data doesn't capture.
Each source has different match IDs, names the same players differently ("Doué" vs "Désiré Doué"), and rate-limits hard enough that you cache aggressively or lose hours. Most of the setup time goes there.
Every successful action then gets scored with an xT (expected threat) model, which is a value 0–1 reflecting how much closer to a goal the action moved the ball. The output is one unified table: coordinates, player, team, match, score, xT. Everything in this post is one or two queries against it.
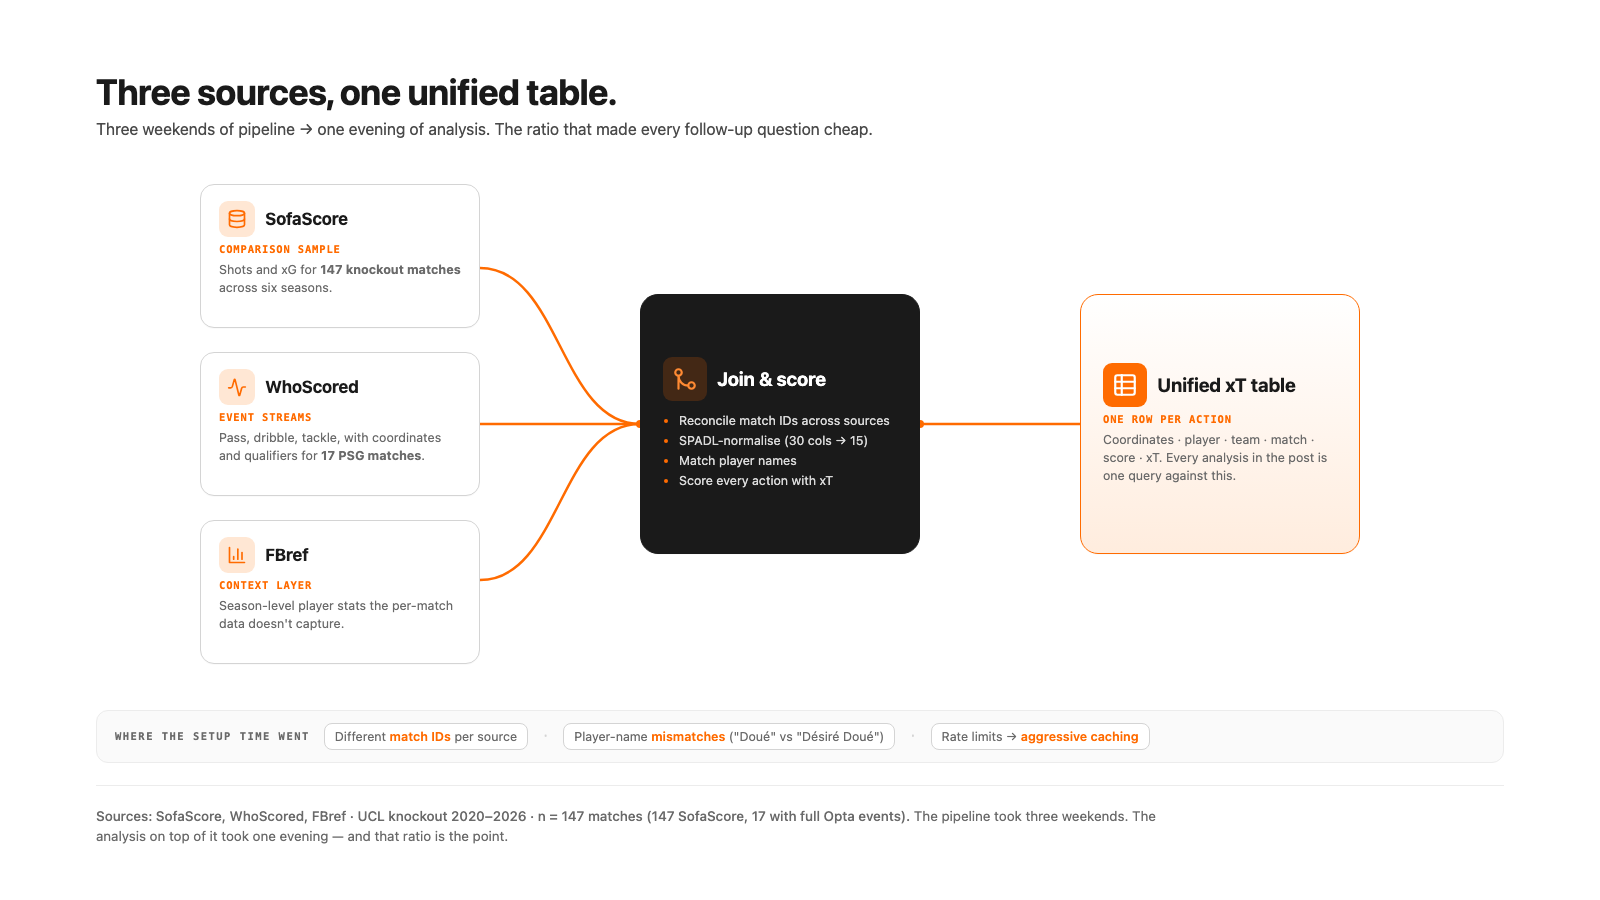
Building the pipeline took three weekends. The actual analysis on top of it took one evening. That ratio is the point.
Why this kind of analysis doesn't scale today
Each follow-up question I asked needed a different shape on the same data: actions joined to pitch zones, then to match metadata, then to raw event qualifiers. Same dataset, three different shapes. Each took an hour once everything was in one place; the setup before that took a week.
This disparity of time spent wrangling data isn't specific to football. A plant manager asking why overall equipment effectiveness dropped this month gets one number back. The follow-ups — is it shift B? line 3? only Tuesdays after maintenance? — need the same operational data sliced three different ways, with the same kind of plumbing: different sources (MES, ERP, quality, maintenance), different IDs (work order, batch, machine), different schemas. Without a data team, most SMEs stop at the first answer. The second takes SQL, Python, or a week of unbilled hours.
That gap, between the first answer and the second, is the problem worth solving.
What we're building
Beetl is for the second, third, and fourth question. You drop your operational files into one place — production logs, ERP exports, quality records, maintenance data — and the joins, cleaning, and name-and-ID resolution happen in a chat session. Those steps save as a repeatable pipeline, so next month's data flows through automatically. When the next question lands, you ask it in plain language and the system handles the re-joins.
The football pipeline took a couple weekends; the analysis on top of it took one evening. That ratio reversal is what we're trying to deliver to manufacturing and logistics teams that can't afford a data hire.
The value isn't in the first answer. That's usually the easy one. It's in being able to ask the next four cheaply, and to keep asking them as new data arrives. That, in the end, is what this football case study is really about.
Shout out to Benjamin Turk who pushed back on the original LinkedIn post. Most of this article exists because he didn't accept the first answer.